
Inventory Turnover and Sell-Through Answer Different Questions
A fast-selling batch can coexist with slow inventory turnover. Compare cost, units, time and stock pools before changing a purchase, a target or a price.

7 years of experience building and operating brand websites, specializing in website development, paid advertising and SEO. Built a brand website from launch to US$10 million in annual sales.
The Short Answer
Use compatible cost values for turnover and an explicit unit pool for sell-through. Keep averaging, receipts, returns, transfers and period boundaries visible, then connect the ratios to dated demand, service and cash before acting.
Key takeaways
- Turnover measures inventory investment; sell-through measures progress through a stock pool.
- Opening and closing values can miss inventory held within the period.
- A new receipt can lower rolling sell-through without changing the original batch result.
- Returns, transfers and write-downs change different parts of the measurement.
- Aggregate compatible numerators and denominators instead of averaging product percentages.
- A high ratio does not compensate for poor availability or lost contribution.

A buyer says a product is selling well because most of the first shipment has gone. Finance says the range is tying up too much money because inventory turnover is low. The warehouse says there is still plenty of stock, while the website is missing the most popular size. These observations can all be correct. They describe different quantities, periods and operating problems.
Inventory turnover and sell-through are useful only when their definitions stay attached to the numbers. Turnover usually compares the cost of goods sold during a period with the average inventory value supporting those sales. Sell-through measures how much of a specified stock pool has sold under a stated unit and time definition. One concerns the movement of inventory investment; the other concerns progress through a quantity of stock.
I would use them together, then connect them to availability, margin and aging before making a purchase decision. Neither ratio should become a universal target detached from the business. This guide uses fictional examples from Willow Linen to show the arithmetic, the traps and the decisions. These are educational operating examples, not financial statements or claims about a real brand’s results.
Choose the question before choosing the metric
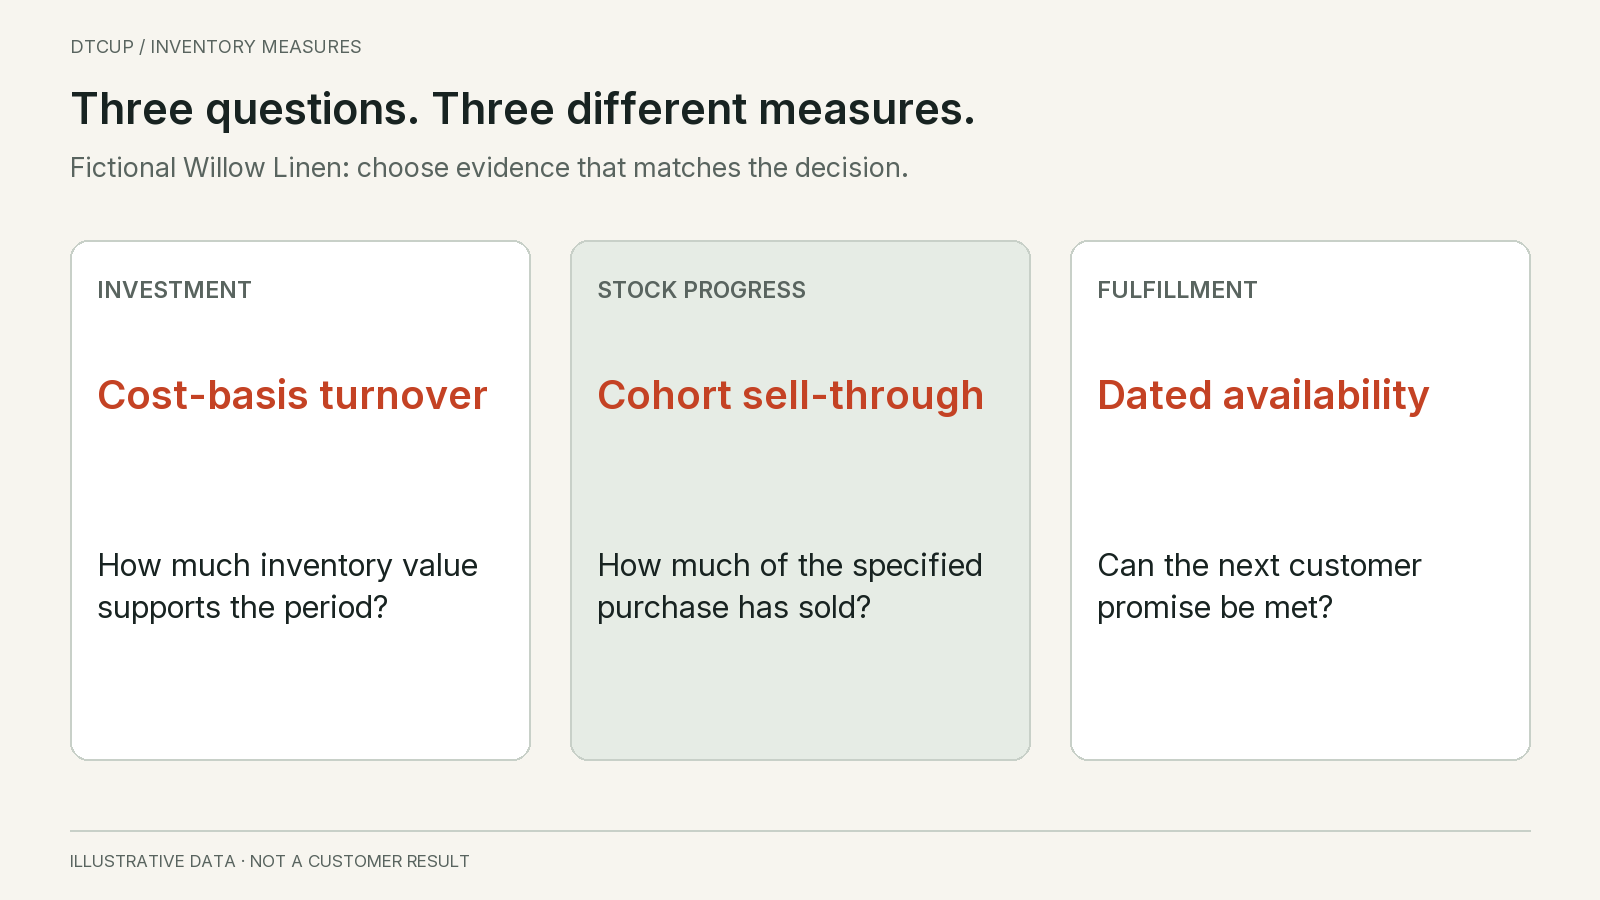
If you want to know whether a seasonal purchase is clearing at the intended pace, start with a defined stock cohort and a sell-through measure. If you want to know how much inventory investment supports the period’s sales, examine cost-basis turnover. If you want to know whether next week’s orders can be fulfilled, neither is sufficient: you need dated demand and usable stock.
A metric becomes confusing when it is asked to answer a question outside its scope. High sell-through of a small launch shipment does not prove that a large reorder will sell. Low turnover before the seasonal peak does not automatically mean the buyer made a mistake. A warehouse with high aggregate turnover can still have unavailable best sellers and aging slow products.
Write the action beside the metric. Willow Linen’s seasonal buyer uses cohort sell-through to decide whether to replenish, change merchandising or stop buying a collection. The finance owner uses turnover and inventory value to investigate capital tied up in the range. The operations owner uses a dated availability plan to protect customer promises.
These owners should share definitions, but they do not need one number to replace all their questions. A useful meeting allows the numbers to disagree and explains why. Forcing them into one inventory-health score can hide the distinction between a cash problem, a demand problem and a location problem.
Start each report with the period, product scope, location scope, quantity basis and cost basis where relevant. A monthly unit metric for available stock cannot be compared directly with a quarterly financial metric that includes inventory in several stages. The first step toward useful analysis is making those boundaries visible.
Calculate turnover on a consistent cost basis
The standard operating formula is cost of goods sold divided by average inventory value for the same period and scope. Shopify’s inventory metrics guide presents that cost-based formula. The important practical detail is that the numerator and denominator need compatible definitions. Sales revenue divided by inventory cost is a different ratio.
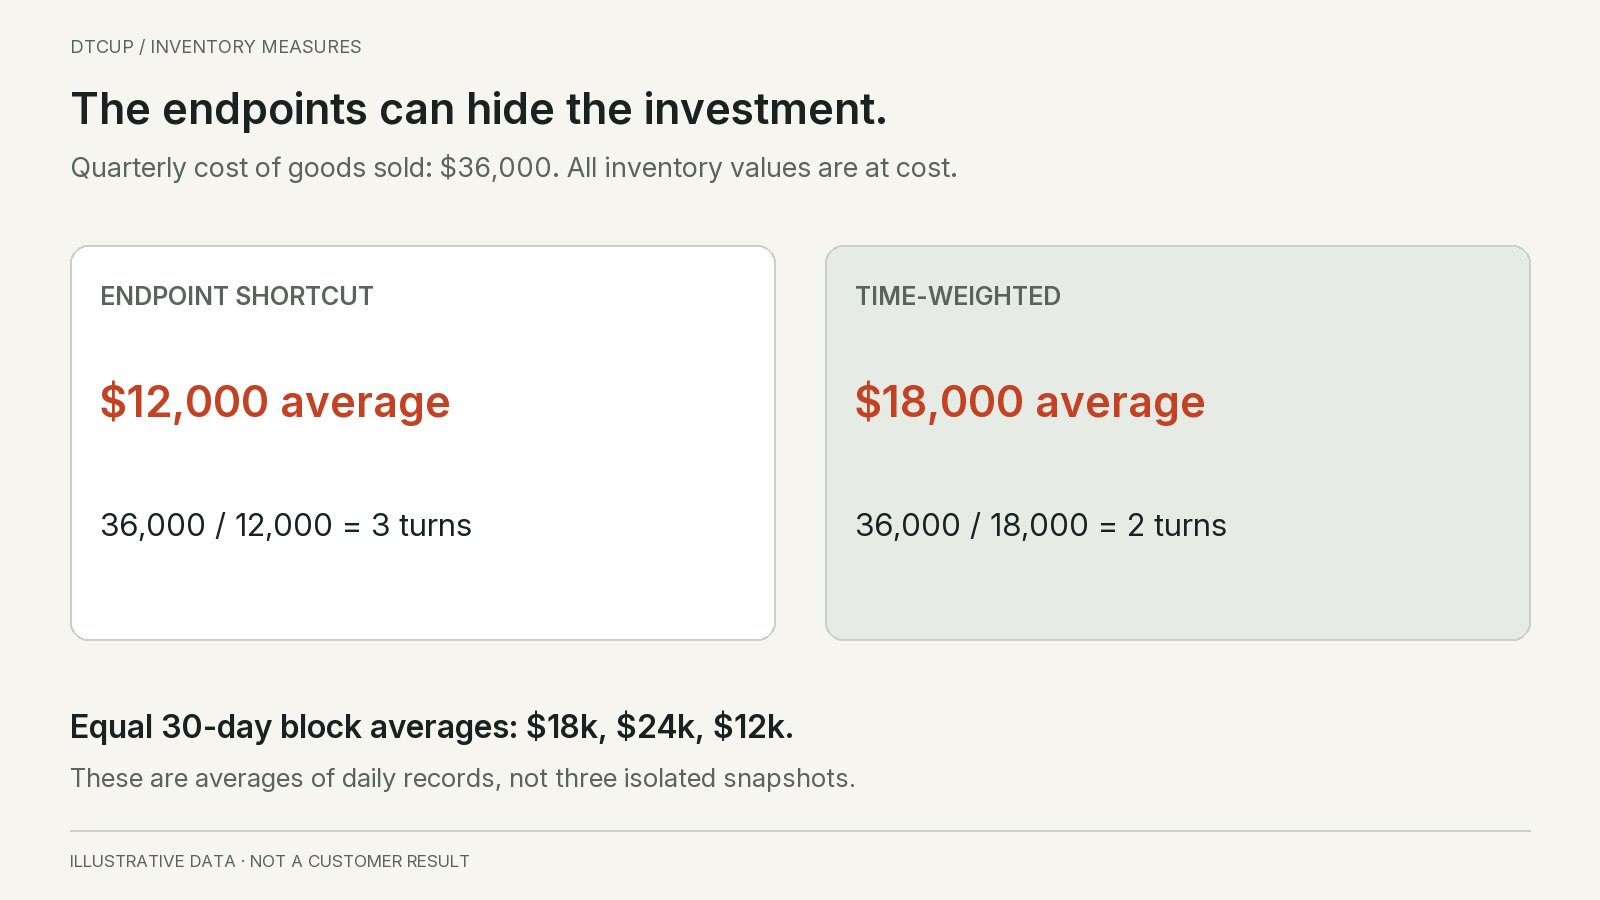
In Willow Linen’s fictional ninety-day quarter, the relevant cost of goods sold is thirty-six thousand dollars and the time-weighted average inventory value is eighteen thousand dollars. Turnover for that quarter is two. This means the period’s cost of goods sold equals twice the average inventory investment under those definitions. It does not mean every physical unit in the warehouse was replaced exactly twice.
Suppose net sales revenue for the same range is ninety thousand dollars. Dividing that revenue by eighteen thousand gives five. Calling five the cost-basis inventory turnover would mix selling value with inventory cost. Changes in price or markup could then make the metric look better without a corresponding improvement in how inventory moves.
Keep the period attached to the result. Two turns in a ninety-day quarter is not the same report as two turns in a year. Multiplying the quarterly figure by four gives a simple annualized rate of eight, but that is a pace conversion, not a forecast that the next four quarters will repeat. Seasonal businesses have particularly good reasons not to treat it as an annual outcome.
Use the organization’s approved accounting cost definitions and reconcile them with the responsible finance owner. A current product-cost field may not represent the cost of historical sales or the carrying value of older inventory. If costs changed, a calculation using today’s cost for every past unit can misstate both the numerator and the denominator.
Keep the analytical purpose clear. An operating dashboard can use a documented approximation when the team understands its limitations. It should not label that approximation as a verified financial turnover figure. If the required cost history or inventory snapshots are missing, show the limitation and the available unit measures rather than fabricating a precise ratio.
Average the inventory you actually held
The common shortcut averages opening and closing inventory. It is easy to calculate, but it can be misleading when receipts, promotions or seasonal builds make inventory vary substantially inside the period. The two endpoints may describe only a small part of the capital the business carried.
Willow Linen starts and ends the quarter with inventory valued at twelve thousand dollars. The endpoint average is therefore twelve thousand. But its daily records show that the average inventory in the first thirty-day block was eighteen thousand, in the second block twenty-four thousand and in the final block twelve thousand.
Because the three blocks have equal duration, the quarter’s time-weighted average is eighteen thousand dollars: the sum of eighteen, twenty-four and twelve thousand divided by three. Using the endpoint shortcut produces turnover of three, while the time-weighted average produces turnover of two. The cost of goods sold has not changed. The difference comes entirely from the denominator.
This example uses block averages derived from daily records, not three arbitrarily selected snapshot dates. If the blocks had different lengths, weight each average by its duration. Similarly, irregular snapshots should not receive equal weight merely because each occupies one row in an export. Establish what each observation represents in time.
Daily closing balances are often a practical operating basis when reliable records exist. State the convention and use it consistently. If a large receipt arrives at the end of a day, that convention affects the average differently from an intraday weighted method. The team does not need unlimited precision, but it does need to understand the method it chose.
Check missing dates before averaging. Treating a missing balance as zero can understate inventory and inflate turnover. Carrying a stale balance forward may also be misleading after a known receipt or adjustment. Label incomplete coverage, repair the source where possible and avoid comparing a complete quarter with an incomplete one as though the methods were identical.
Define the stock pool behind sell-through
Sell-through is not one universally implemented formula. A cohort measure can compare units sold from an identified purchase with that purchase’s quantity. A rolling operational report may compare units sold with units sold plus ending inventory. Another report may divide sales by receipts during a period. These measures can differ even when the underlying records are correct.
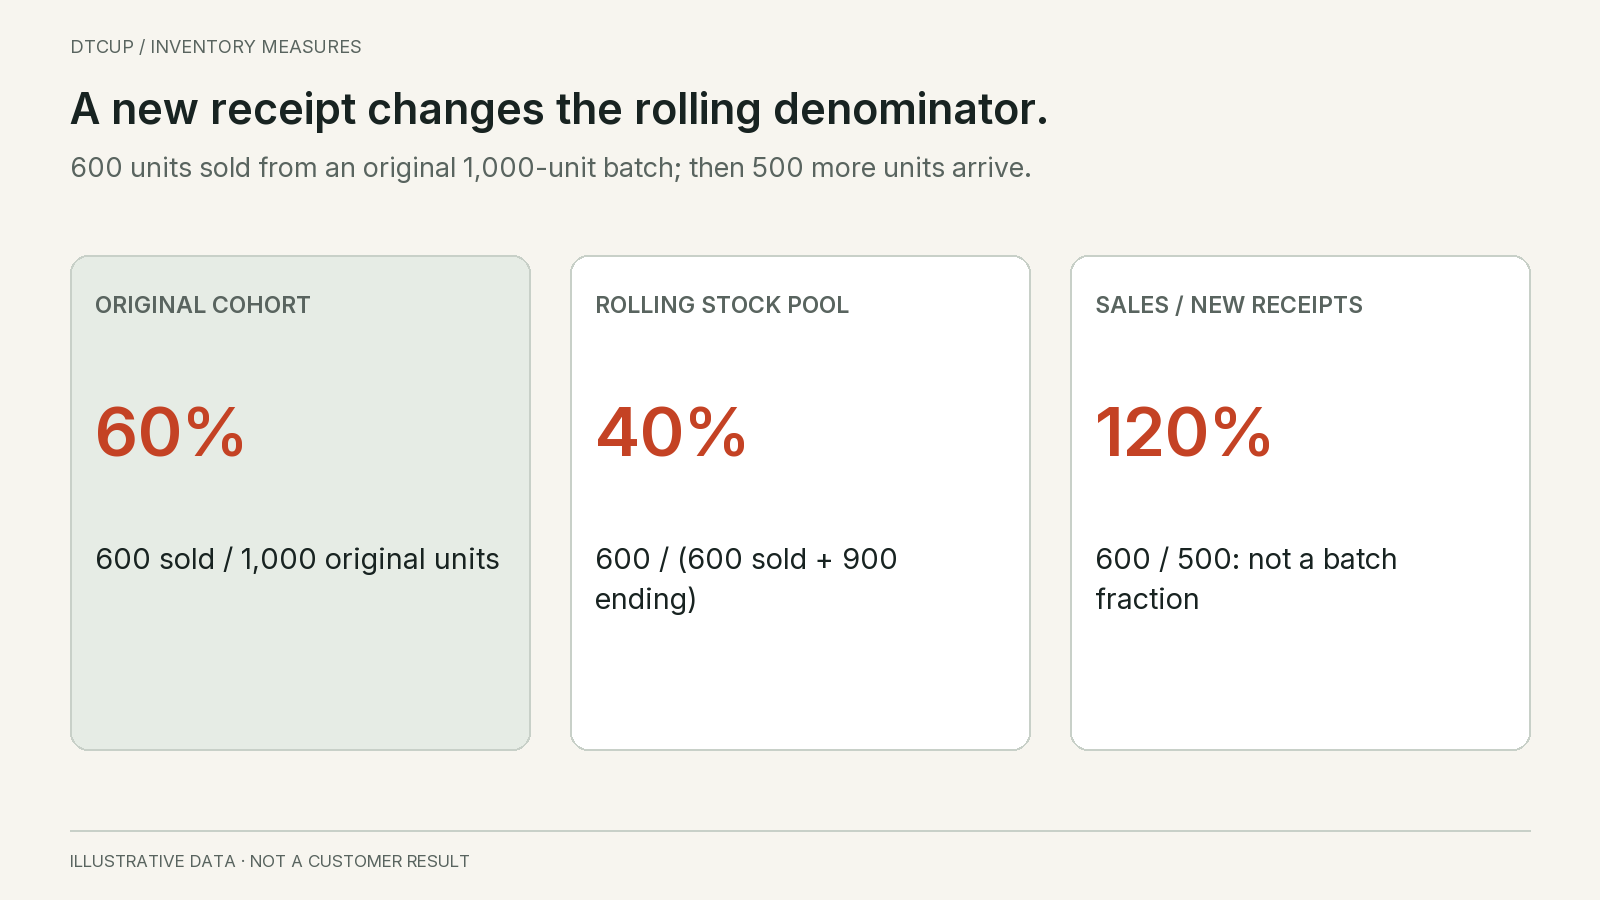
Willow Linen receives an initial batch of one thousand linen sets. It sells six hundred from that batch and has four hundred remaining, with no returns or other movements in this simple example. Cohort sell-through is sixty percent. The numerator and denominator refer to the same batch, so the result answers how much of that original purchase has sold.
Now a new shipment of five hundred sets arrives near the end of the reporting window, with no additional sales yet. Ending stock becomes nine hundred. A rolling measure of six hundred sold divided by six hundred sold plus nine hundred ending stock gives forty percent. The first batch still has sixty-percent cohort sell-through. The new receipt changed the rolling denominator, not the historical sales of the first batch.
Dividing six hundred units sold by only the five hundred units received during that same window would produce one hundred twenty percent. That is not evidence of impossible physical sales. It reveals that the numerator includes sales from opening inventory while the denominator includes only new receipts. Such a ratio should not be presented as the share sold from the new shipment.
Shopify’s product analytics documentation defines its product sell-through calculation as units sold divided by units sold plus remaining inventory, using its stated recent reporting period. That is a product-specific definition. Check the dates and scope shown in the report rather than assuming it matches a purchase-cohort calculation in your own workbook.
Choose the measure that supports the decision and label it precisely. For an initial seasonal buy, a purchase-cohort view can be useful if the inventory records support it. For a rolling range review, a consistently defined operational measure may be sufficient. Do not switch formulas when one produces a more flattering percentage.
Do not invent purchase-cohort traceability
A cohort calculation requires knowing which stock pool the sales belong to. If identical products from several receipts are mixed and the system does not track allocation to those receipts, the team may not have direct evidence of physical batch sell-through. A financial cost-flow assumption is not automatically a physical movement record.
Willow Linen can calculate total units sold and total ending stock without knowing which particular carton supplied each order. If it allocates sales to the oldest receipt for planning purposes, it should label that as an allocation convention. It should not claim that the warehouse physically picked those exact units unless the records support the claim.
This matters when batches differ in quality, expiry, packaging or cost. A purchase cohort may require lot tracking or another reliable movement record to answer the question. If that information is absent, use a broader product-period measure and state the limitation. A precise-looking cohort chart built from an unverified assumption can misdirect a supplier discussion.
Keep planning allocation and accounting treatment coordinated but distinct. The finance owner determines the applicable accounting method. The operations owner verifies what physically moved. The analyst should not silently use a convenient warehouse assumption to rewrite cost of goods sold, or use a financial convention as proof of physical lot identity.
When improving the data, focus on the decision that needs it. If the business needs to isolate a defective batch, traceability is operationally important. If it only needs a broad replenishment signal for interchangeable units, a consistent aggregate measure may be adequate. Avoid adding tracking complexity without a clear use and an owner who can maintain it.
Reconcile returns and stock movements before interpreting a percentage
Sales, refunds and sellable stock do not move together automatically. A refund can occur before goods return. Returned goods can be damaged or held for inspection. A replacement can leave the warehouse without being a new customer purchase. Treat these as distinct events so the metric describes the intended business activity.
Consider a separate return example with a one-thousand-unit batch and six hundred shipped sales. Fifty units are later returned and fully refunded. Forty are approved for resale and ten remain in inspection. There are no other movements. The business now physically holds four hundred fifty units: four hundred never sold, forty sellable returns and ten held returns.
Gross shipped sell-through for the original batch remains sixty percent. Net retained units are five hundred fifty, or fifty-five percent of the original batch. Sellable stock is four hundred forty, while total physically held stock is four hundred fifty. These are different, useful answers. A report should not choose one without stating its treatment of returns and holds.
For a demand forecast, the organization may deliberately retain eligible ordered units before refunds and show refunds separately. For a net-retention view, returns reduce the numerator. For a fulfillment plan, only stock released for the intended use is available. The demand-history guide explains why those definitions should not be collapsed into one sales field.
Transfers need similar care. Moving units from one warehouse to another reduces one location’s stock and increases another’s, but does not create a company-level sale. A location report that treats every outbound movement as sales will overstate sell-through. Reconcile transfer pairs and preserve goods in transit under the chosen ownership and availability rules.
Write-offs, samples and service replacements also need separate movement categories. They can reduce remaining stock without demonstrating customer demand. If a percentage improves after damaged goods are removed, explain the adjustment rather than calling it stronger selling performance. A healthy inventory review follows the reason for movement, not only the direction.
Aggregate the underlying quantities, not the percentages
Range-level metrics need appropriate weighting. Averaging product turnover ratios gives each product equal influence regardless of the inventory investment involved. That can hide the capital tied up in a large slow-moving category behind a small fast-moving one.
In a fictional quarter, Willow Linen’s core range has cost of goods sold of thirty thousand dollars and average inventory of six thousand. Its turnover is five. The seasonal range has cost of goods sold of six thousand and average inventory of twelve thousand. Its turnover is one half. The simple average of five and one half is two point seven five.
But the combined range has cost of goods sold of thirty-six thousand and average inventory of eighteen thousand. Its turnover is two, not two point seven five. The correct aggregation uses the underlying cost quantities for the same period and scope. The slower range carries twice the average inventory of the faster range, so equal weighting would understate its influence.
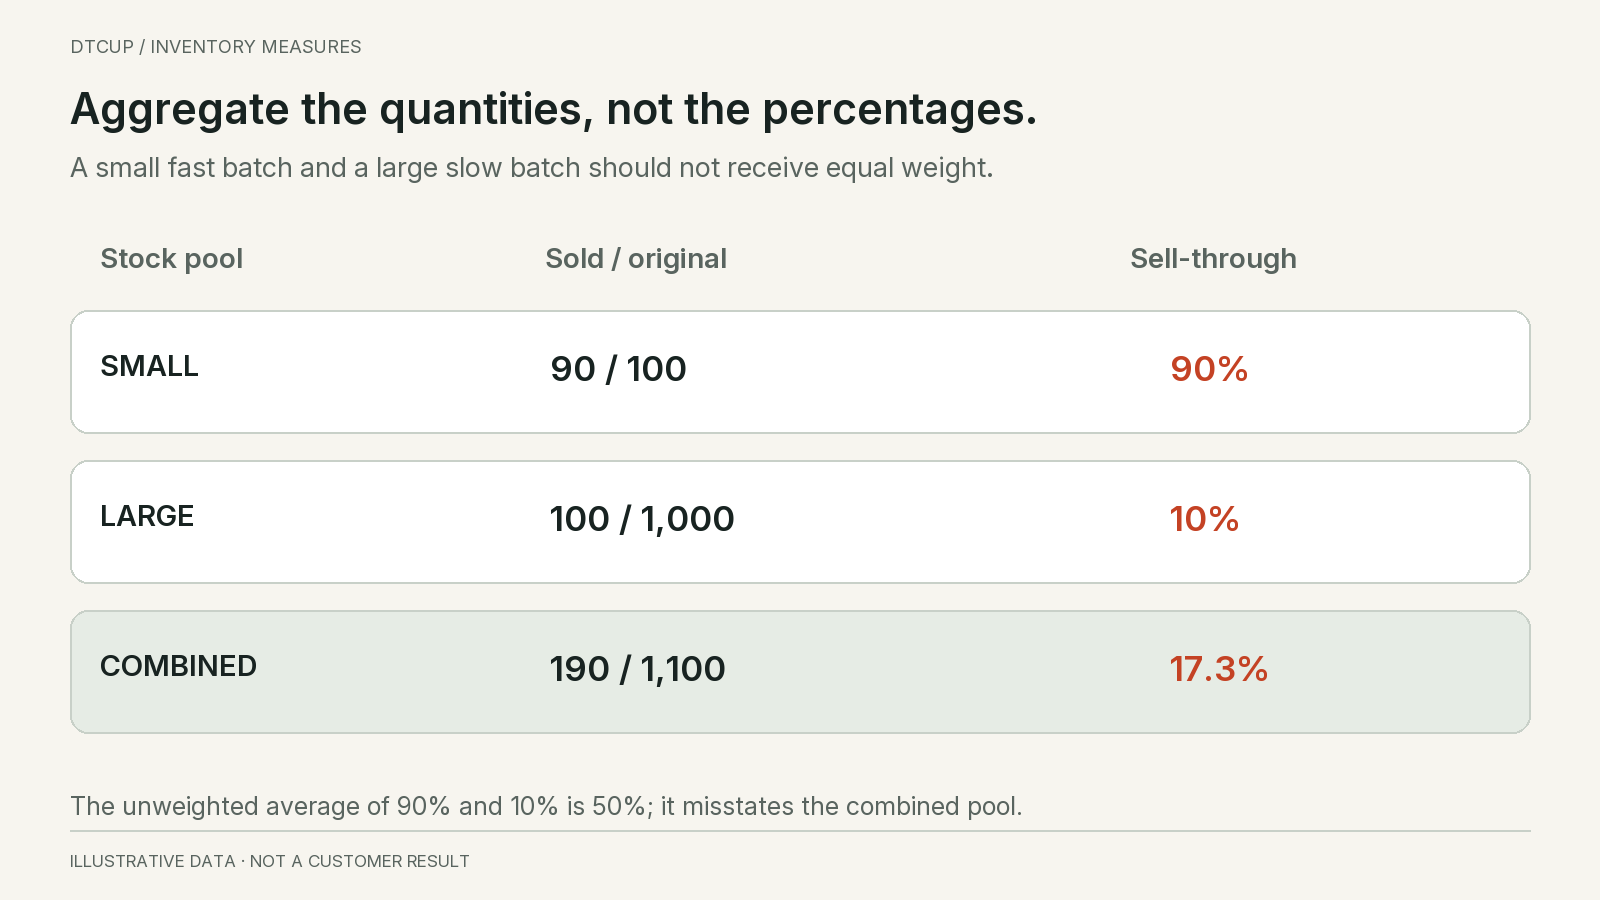
Sell-through has the same kind of aggregation problem. If one cohort sells ninety of one hundred units and another sells one hundred of one thousand, their rates are ninety percent and ten percent. The simple average is fifty percent. Combined units sold are one hundred ninety from one thousand one hundred, approximately seventeen point three percent.
Neither product rate is wrong. The error is treating an unweighted average as the combined stock result. Show the product-level differences and the quantity-weighted aggregate. If the business intentionally wants an average across products, label that separate statistic clearly rather than presenting it as the share of total inventory sold.
Do not aggregate incompatible units casually. A set, a single component and a case of products may require conversion before a combined unit measure makes sense. Cost values can provide a common financial basis when accurate, but they still need consistent scope. The forecast measurement guide develops the broader problem of averages hiding important product differences.
Read cost changes and write-downs as financial events
Inventory value can change without an equivalent movement in physical units. Purchase costs, exchange rates under the applicable accounting treatment, valuation adjustments and write-downs can affect the financial view. A turnover change therefore needs an explanation of both unit activity and value changes.
The IFRS Foundation’s summary of IAS 2 explains that inventory measurement includes cost assignment and possible write-downs to net realisable value. Which accounting requirements apply to a particular business is a matter for its finance professionals. The operating lesson here is to avoid interpreting every reduction in carrying value as successful selling.
For a simplified sensitivity illustration, hold cost of goods sold at thirty-six thousand dollars and compare average inventory of eighteen thousand with fifteen thousand. The ratio moves from two to two point four. That arithmetic alone cannot tell you why the denominator changed. It might reflect less physical stock, a different cost basis or a valuation adjustment.
If a write-down is involved, the actual financial calculation may affect more than one reported line depending on the accounting presentation and timing. Do not use the simplified sensitivity as a substitute for reconciling the real ledger. Ask finance to identify the changes and show a bridge that distinguishes operating movement from valuation effects.
Keep aged units visible after their carrying value falls. Stock that is financially written down can still occupy warehouse space and require a disposal or recovery decision. A lower financial denominator should not make the operational problem disappear from the review. Pair value with units, age and the remaining action.
Similarly, an increase in unit cost can raise inventory investment even when the physical quantity is stable. The buyer may need to review cash exposure without assuming demand has slowed. Separate price, quantity and mix effects so the team can choose an appropriate response rather than chasing the ratio blindly.
High turnover is not always evidence of a healthy range
Turnover can rise because the business holds less stock. That may be efficient, but it may also mean repeated stockouts. If the popular size is unavailable for much of the month, a lean inventory balance can coexist with lost demand and poor customer service. The ratio alone does not reveal that tradeoff.
Check availability and service outcomes alongside turnover. Look at unavailable periods, delayed orders, substitutions, cancellations and the reliability of the promised delivery date. Distinguish a deliberate lean policy supported by dependable replenishment from a cash constraint that prevents the business from stocking what customers want.
High sell-through can also result from an intentionally small initial buy. That is often a sensible experiment, but it does not prove that a much larger quantity will sell at the same rate. Exposure, launch attention and early demand can differ from the next period. Use the short-history reorder method before converting a strong launch percentage into a large commitment.
Discounting can accelerate unit movement while weakening contribution. A clearance may be the right decision when it recovers cash or releases space, but describe it as that decision. Do not claim that faster movement automatically means a more profitable range. Compare the recovery value and remaining costs with realistic alternatives.
Low turnover can be intentional too. A long replenishment lead time, an agreed service requirement or a seasonal build may justify holding more stock. The question is whether the amount and timing are supported by the plan, not whether they match an online benchmark. The safety-stock guide connects inventory buffers to service decisions.
My preference is to ask what changed operationally when a ratio moves. Did receipt timing improve? Did order quantities shrink? Did demand weaken? Did the assortment shift? A useful explanation connects the arithmetic to an action the team can retain, adjust or investigate.
Use aging to find what a blended ratio hides
A range can have acceptable aggregate turnover while a meaningful portion of inventory has barely moved. Fast sellers repeatedly cycle through the business and dominate cost of goods sold. Slow stock remains in the denominator but may not stand out in a single total. An aging view helps identify where the next decision belongs.
Define age carefully. Time since receipt, time since last sale and time since product launch answer different questions. A recent transfer between warehouses should not necessarily make old stock look new. A new receipt of a slow product should not erase the fact that older units remain. Preserve the relevant receipt or lot history where the system supports it.
Split aged inventory into actionable groups. Some units can sell through the normal channel with better exposure. Some need a price or bundle decision. Some are blocked by quality, incomplete content or an incorrect stock status. Some have no credible recovery route. These situations should not all receive the same automatic markdown.
Consider the cause before the remedy. A product with weak demand is different from a product that was hidden from the website. A product unavailable in the right location is different from one with no customer interest. Review evidence about visibility, availability and price before interpreting low movement as a final verdict on the product.
Pair the proposed action with expected cash recovery, contribution, space released and customer effects. The MOQ and excess-inventory guide shows how a lower unit cost can create a larger inventory commitment. Aging analysis helps assess what happened after that commitment, rather than judging the original purchase by unit price alone.
Connect turnover to margin without calling it profit
Turnover describes movement relative to inventory investment, but it does not include the selling margin. Two ranges can turn at the same rate and generate very different amounts of gross profit. For an assortment decision, examine both the rate of movement and the money retained before other operating costs.
Return to the simplified quarter with ninety thousand dollars of net sales, thirty-six thousand of cost of goods sold and eighteen thousand of average inventory. Gross profit is fifty-four thousand dollars under those stated definitions. Dividing that gross profit by average inventory gives three dollars of quarterly gross profit for each dollar of average inventory investment.
This is a gross-margin return on inventory investment calculation for the stated period. It is not net profit, a cash return or an annual guarantee. Advertising, fulfillment costs outside the chosen cost-of-goods-sold definition, payment fees, support and overhead may still need consideration. Do not present a strong gross-margin ratio as proof that the range is profitable after all costs.
A clearance can improve turnover while reducing this margin return. Suppose the same quantity moves at a lower selling price, with unchanged product cost and average inventory for a simplified comparison. Cost-basis turnover can stay unchanged while gross profit falls. If the clearance also reduces the inventory held over time, both the denominator and margin change. Explain the combined effect rather than selecting the favorable metric.
The reverse situation is possible too. A premium range may move slowly but produce substantial margin per sale. That can justify some inventory investment, although aging and future demand still matter. Compare realistic contribution, capital and service requirements. The aim is not to declare fast or slow movement inherently good; it is to understand what the investment earns and what risks it carries.
Cash timing remains a separate question. Suppliers may require deposits long before receipt, while customer payments and refunds follow their own timing. A profitable sale does not necessarily mean cash is available when the next purchase payment falls due. Use a cash plan alongside the inventory measures when the reorder could strain liquidity.
Keep ownership and availability separate
The inventory included in a financial measure may not match the stock available to promise on the website. Goods in transit, quality holds, reservations and third-party locations can have different treatment depending on ownership, accounting policy and operational status. A report must define those boundaries rather than assuming one stock quantity serves every purpose.
For example, goods can be economically part of the business’s inventory under its applicable arrangements while still being unavailable for customer shipment. Excluding them from a fulfillment calculation may be correct. Excluding them from an inventory-investment review solely because they are not yet on a shelf may be wrong. Have finance and operations agree the respective scopes.
Reservations are another source of confusion. Reserving an item for an order can reduce available-to-promise stock without reducing physical stock at that moment. If the turnover denominator uses only unreserved stock while the numerator follows a different sales-recognition event, the ratio may no longer describe a consistent investment basis. Document when each system changes state.
Supplier deposits should also remain distinguishable from inventory balances. Money paid toward a future shipment is a cash commitment, but its financial classification depends on the actual transaction and applicable accounting treatment. Do not automatically add every purchase-order value to inventory or ignore the commitment because the warehouse has not received anything.
This is why I prefer a small set of connected views: financial inventory investment, physical movement, usable availability and committed cash. They should reconcile through explicit differences, not be forced to equal one another. The inbound inventory guide develops the operational side of this distinction, including receipt timing and release for use.
Compare like operating periods before setting a target
A useful comparison controls for the point in the buying cycle. The month immediately after a large seasonal receipt will naturally look different from the final clearance month. Comparing those two percentages without context may punish a necessary inventory build and reward a period when the business has almost nothing left to sell.
For seasonal ranges, compare equivalent positions in the season where reliable history exists. Also compare the current result with the approved plan. A lower sell-through rate can be acceptable if the receipt arrived earlier and the main selling window is still ahead. The same rate can be concerning if the peak has already passed.
Keep product mix visible when comparing periods. If the range adds a high-cost slow-moving category, aggregate turnover can fall even when every established product behaves as before. Separate like-for-like products from assortment changes, then explain the combined result. That produces a better buying discussion than asking all category owners to reach the same ratio.
When history is too short for a comparable period, say so. Use a plan, a bounded analog or scenario ranges instead of inventing year-over-year evidence. A young brand can still make disciplined decisions without pretending it has several complete seasonal cycles. The missing history should influence commitment size and review frequency, not disappear behind a precise dashboard.
Build a metric sheet someone else can reproduce
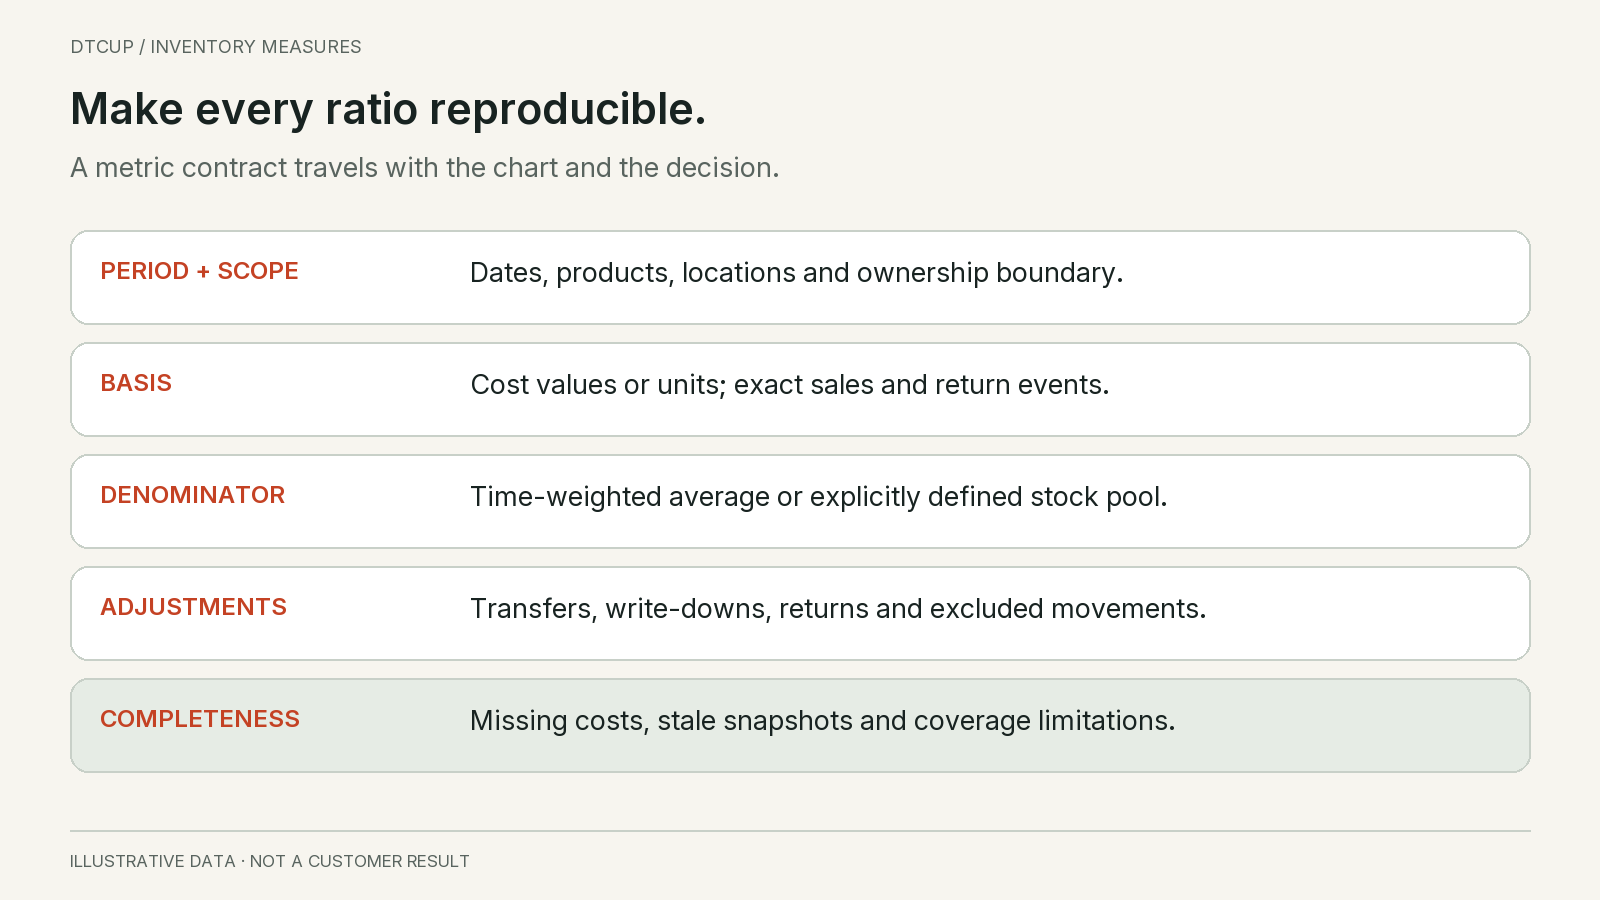
A useful metric sheet contains a short definition and a route back to the records. For turnover, record the cost-of-goods-sold source, inventory valuation source, period, averaging method, product and location scope, currency and material adjustments. For sell-through, record the stock pool, unit event, return treatment, receipt treatment and period.
Keep a movement reconciliation beside the unit metric. Opening stock plus receipts, accepted returns and transfers in, less sales shipments, transfers out and other disposals, should explain closing stock under the defined scope. Investigate unexplained adjustments instead of hiding them in the sold quantity.
Then reconcile the value view separately. Quantity times a current unit cost may be a useful estimate for some decisions, but it does not necessarily reproduce the financial inventory balance. Preserve the finance source and explain differences. A dashboard should not imply accounting precision merely because it displays two decimal places.
Include data freshness and completeness. A stock snapshot from yesterday and sales through this morning are not automatically a valid matched period. Delayed returns, incomplete locations and missing cost records affect interpretation. Show the most recent complete comparable period where appropriate and keep incomplete current data labeled.
Use sensible handling for zero or invalid denominators. If average inventory is zero or missing, turnover may be undefined or not assessable. If a cohort quantity is unknown, sell-through cannot be responsibly calculated from it. Do not display zero percent or an enormous number as a substitute for a data-quality explanation.
Turn the review into a specific action
A reconciliation should also survive a warehouse transfer. Suppose the business moves eighty units from its central warehouse to a regional site, and none have yet been sold. The central site’s ending stock falls by eighty, but the business has not sold eighty additional units. If the local sell-through calculation mistakes all stock reduction for customer sales, it will reward transfers as though they created demand. At the combined business level, the transfer should cancel between locations, with any in-transit state accounted for explicitly. At the destination level, it changes the available stock pool and therefore may change a rolling percentage. Keep the transfer identifier, dispatch event and receipt event connected so the same goods are neither lost between reports nor counted twice. This simple test often exposes a metric that was built from balance differences without understanding the underlying movement types.
Willow Linen’s review begins with the seasonal range. Its lower turnover is largely expected before the peak, but a portion of older stock is not part of the current seasonal plan. The buyer separates that stock rather than treating the entire range as one problem. The first decision is to stop replenishing the aging variant while checking whether its product presentation is limiting demand.
The core range has higher turnover, but the most popular size has several unavailable periods. The action is not to push turnover even higher by cutting stock again. The team reviews receipt timing and the service buffer for that size. A different size with slow movement gets a separate merchandising decision. The range average does not dictate identical treatment.
The seasonal cohort is sixty percent sold, while the rolling report shows forty percent after the new receipt. The team records the denominator change and avoids an unnecessary panic discount. It then checks whether the new receipt can sell during the remaining season under the updated demand scenarios. The percentage explains the past; the dated plan supports the next commitment.
For each decision, state the owner, expected effect, cost and review point. A stock reduction should be checked against availability and contribution. A clearance should be checked against net recovery and customer expectations. A data repair should be checked by reproducing the corrected metric, not by celebrating a more attractive dashboard value.
Do not wait for a complete system before making a bounded decision with reliable evidence. A verified count, a known receipt and a clear selling window may be enough to stop an obviously excessive reorder. Equally, do not invent financial turnover when the cost history is absent. Use what the evidence supports and name what remains unknown.
Questions about turnover and sell-through
What is a good inventory turnover ratio?
There is no single useful target for every product and business. Compare a consistently defined ratio with the range’s lead times, service requirements, seasonality, margin and historical operating plan. Investigate why it differs before changing stock. A high ratio accompanied by repeated shortages can be worse than a lower ratio that supports profitable reliable service.
Can sell-through exceed one hundred percent?
A sales-to-current-period-receipts ratio can exceed one hundred percent when opening inventory also supplies sales. A correctly defined fraction sold from a fixed cohort has a different boundary. Check the formula, returns and movement scope before interpreting the number. The same label can hide different denominators.
Can I use sales revenue instead of cost of goods sold?
You can calculate a revenue-to-inventory ratio if it serves a defined purpose, but do not label it as the same cost-basis turnover measure. Selling prices and markup then affect the result. Keep the numerator and denominator definitions visible and avoid comparing it with a cost-based benchmark.
What if accurate inventory cost history is missing?
Show financial turnover as unavailable or explicitly approximate, depending on the evidence and approved use. Continue with verified unit movement, stock aging and availability measures while improving the source data. A current cost field and one present-day stock count cannot establish a historical average inventory investment.
Which number should drive the next reorder?
Use turnover and sell-through to identify questions, then make the reorder with a dated demand forecast, usable stock, inbound timing, service needs and cash constraints. A backward-looking ratio cannot show the exact day a shortage will occur. The dated stock-cover guide connects those next-step quantities.
Sources
Still have a question?Ask the DTCUP Community ↗