
Allocate the Next Marketing Dollar by Contribution, Not Historical ROAS
A strong historical return can hide a weak next investment. Work through margin, incremental response, funding tradeoffs and cash constraints before increasing a channel budget.

7 years of experience building and operating brand websites, specializing in website development, paid advertising and SEO. Built a brand website from launch to US$10 million in annual sales.
The Short Answer
Evaluate the proposed spending difference rather than ranking channels by historical averages. Estimate incremental revenue on a reconciled basis, subtract variable and change costs, account for the value lost where funding is removed, and enforce cash and operating constraints.
Key takeaways
- Attributed revenue does not establish incremental demand.
- Margin differences can reverse a historical ROAS ranking.
- The next spending block has a different return from the average.
- A budget transfer must include the value lost at its funding source.
- Uncertain contribution ranges require bounded decisions and review.
- Inventory and cash can constrain an otherwise attractive increase.

A channel can have the best reported return on ad spend and still be the wrong place for the next dollar. Its historical customers may be easy to reach, its current audience may be nearly exhausted, or the products it sells may leave little contribution after returns and fulfillment. Moving budget by ranking last month’s ROAS assumes that the next purchase of media behaves like the average of all previous purchases.
I would separate three decisions. First, what commercial value did the existing activity produce under a stated measurement method? Second, what additional outcome is plausible if spending changes? Third, can the business fund and fulfill that outcome at an acceptable margin and risk? A budget recommendation becomes much stronger when those questions are answered in sequence.
This guide builds that sequence with fictional examples. It is an operating method for marketing and finance teams, not a claim that a particular attribution model can prove causality or a recommendation for any live advertising account. The examples intentionally keep revenue, contribution, cash and uncertainty visible so a founder can challenge the assumptions before changing spend.
Name the budget decision precisely
“Which channel is best?” is usually the wrong starting question. A team may need to allocate a fixed budget, decide whether to increase total spending, preserve a minimum level of new-customer acquisition or reduce cash exposure before a stock purchase. Each problem has a different objective and constraint. A ranking cannot answer all of them at once.
Write the proposed decision as a change over a defined period. For example, consider whether to move $2,000 of next month’s discretionary media budget from one campaign family to another, while keeping fulfillment capacity and the minimum cash reserve intact. Specify whether creative production, agency fees and promotional discounts change with that decision.
Identify what stays fixed. A fixed total budget means an increase somewhere requires a reduction elsewhere. A flexible budget asks whether additional spending creates enough incremental contribution to justify the cash and risk. If the comparison quietly switches between these problems, a recommendation can look attractive merely because it spends more money.
Also define the unit of allocation. A broad channel may contain branded search, prospecting, retargeting and different markets. Their next-dollar economics can differ materially. However, splitting into extremely small segments can produce unstable estimates and false precision. Use the finest level at which the evidence and actual buying controls support a defensible decision.
The decision record should state the owner, review date, permissible range, customer or operational guardrails and what would reverse the change. That is useful even before a sophisticated model exists. It prevents a temporary test from becoming a permanent budget shift simply because nobody scheduled the review.
Reconcile commercial value before judging channel efficiency
Start with a value measure the team can explain. Gross order value, net merchandise revenue, captured payment and contribution are different quantities. Discounts, cancellations, refunds, shipping income and tax treatment can change the comparison. Choose the basis for the decision and use it consistently across the candidate activities.
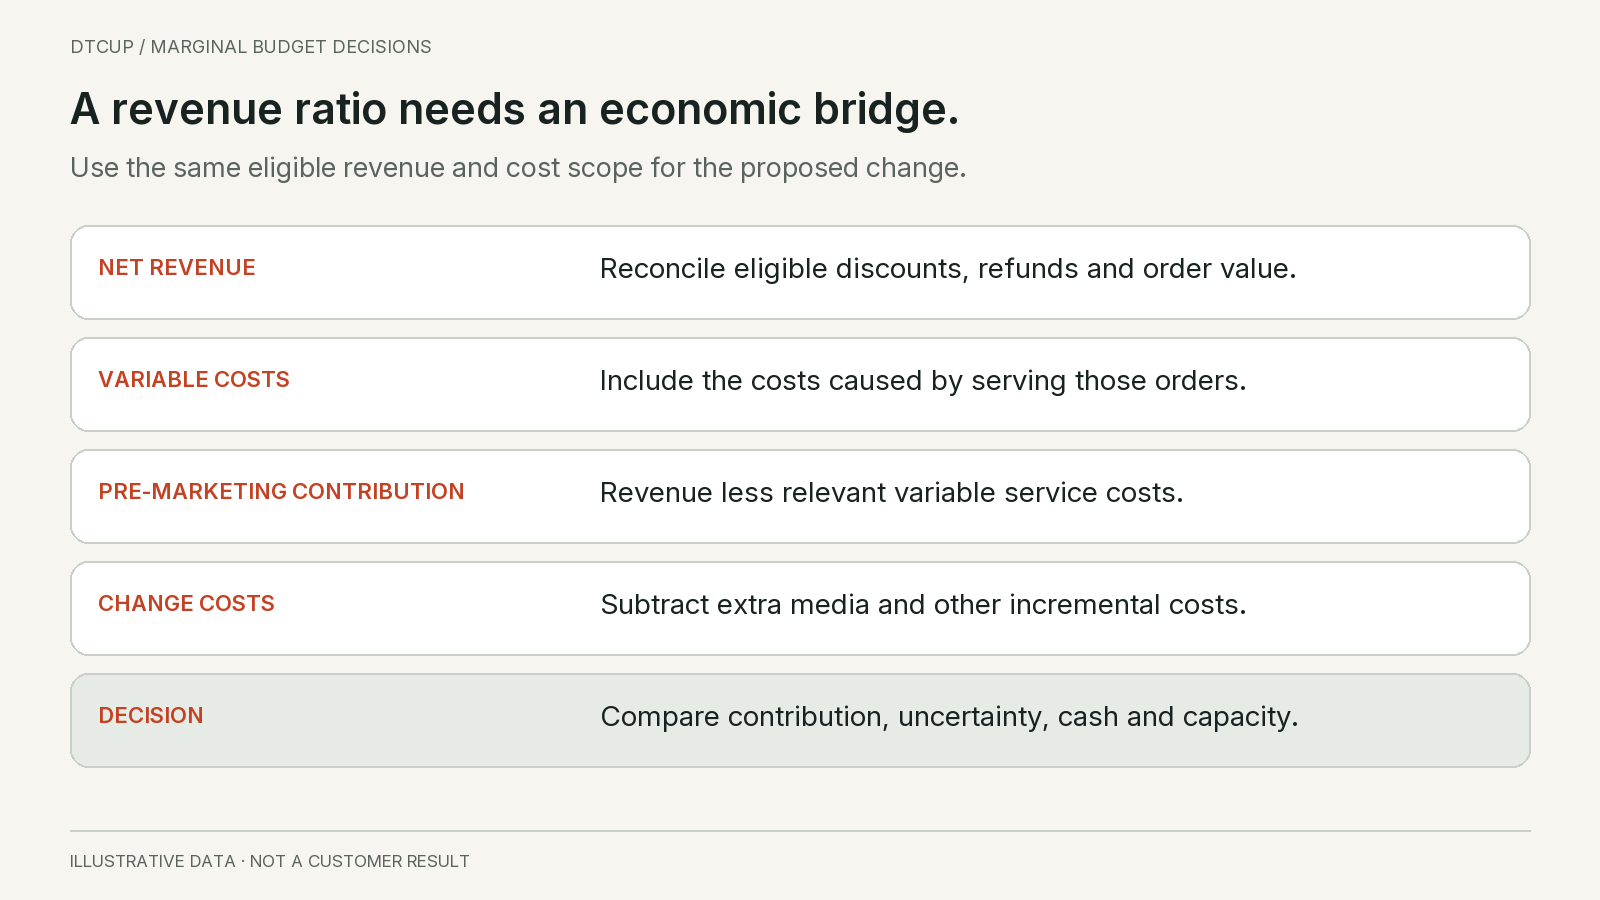
For a marketing contribution view, a useful starting point is eligible net revenue less the variable costs associated with serving those orders. The exact cost categories need agreement with finance. They may include product cost, fulfillment, payment fees, shipping subsidy, expected or realized return handling and variable support. Do not assume the name of a dashboard metric guarantees all those components are present.
Keep marketing spend outside the pre-marketing contribution calculation if you later subtract it explicitly. Otherwise the same spend can be deducted twice. State whether creative and agency costs are fixed for the decision, variable with spend or a separate one-time investment. A cost can be economically relevant without belonging in every per-order calculation.
The refund and attribution ledger guide explains how postpurchase changes revise value. That foundation matters here because a channel attracting high-return orders may appear attractive on purchase day and less attractive after the cohort matures. Compare cohorts at a similar age or label the remaining adjustment estimate.
Do not describe this operating contribution measure as audited profit. Fixed overhead, financing, tax and accounting recognition may sit elsewhere. The point is to identify the economic change relevant to the spending choice while keeping the boundary explicit. Finance should be able to reconcile the chosen measure to the broader accounts.
See why identical revenue ratios can hide different economics
Consider Juniper Living, a fictional brand comparing two campaign groups. Campaign Oak spends $10,000 and receives $50,000 of attributed net merchandise revenue under the selected reporting method. Campaign Pine spends $10,000 and receives $40,000. Oak has a reported revenue ROAS of five, while Pine has four.
Suppose the served product mix leaves Oak with a twenty percent pre-marketing contribution rate and Pine with thirty-five percent. Oak’s attributed pre-marketing contribution is $10,000; subtracting the $10,000 media spend leaves zero under this scoped view. Pine’s attributed pre-marketing contribution is $14,000; subtracting media leaves $4,000.
That example shows why revenue ROAS is not a margin measure. It does not yet prove Pine causes more profit. The revenue is still attributed under a chosen model, and some purchases may have happened without either campaign. The arithmetic corrects the economic basis; it does not supply the missing counterfactual.
Inspect the source of the margin difference. It could be product cost, discount depth, shipping geography, return rate or a fulfillment surcharge. If the next budget increment changes the product or customer mix, the historical rate may not apply. A channel average is a useful description of the past, not a permanent characteristic of the channel.
Keep both the revenue and contribution views available. Revenue can still help explain demand and operational volume. Contribution helps assess what remains to fund the business. Hiding one measure in favor of the other loses context; labeling their different purposes makes the budget discussion more precise.
Do not turn attributed contribution into incremental contribution by renaming it
Attribution assigns observed conversion value to touchpoints under a rule. Incrementality asks what changes because the marketing activity occurs. Applying a margin rate to attributed revenue produces attributed contribution. It does not prove that all of that contribution would disappear if the channel stopped.
For example, a branded search campaign may receive credit for customers already looking for the brand. A prospecting campaign may influence demand that later converts through direct or search traffic. Neither observation alone establishes the causal value of the activity. The budget decision needs evidence suited to the intervention being considered.
A well-designed experiment can estimate the effect of a specific spending or exposure change within its scope. A credible marketing mix model can support broader scenarios under its assumptions. Operational attribution can help diagnose paths and compare observed cohorts. Use each for the question it can support rather than forcing every source into one authoritative-looking ranking.
Do not estimate a universal “incrementality percentage” once and apply it to every future budget level. The relationship may change with audience, spend, market, creative, season and other channels. If a factor is used as a planning approximation, label its origin, scope and uncertainty, and explain when it needs to be revisited.
The attribution and incrementality guide covers disagreement between those evidence types. For budget allocation, the essential discipline is to preserve the label on the value being optimized. An observed allocation and a causal estimate can both be useful, but they should not be presented as interchangeable facts.
Compare the next increment, not the historical average
Average return divides the outcome from a spending level by that spending. Marginal return concerns the additional outcome from a small increase near the current level. A channel can have a strong average because its earlier spending reached highly responsive customers, while its next increment reaches a less responsive or more expensive audience.
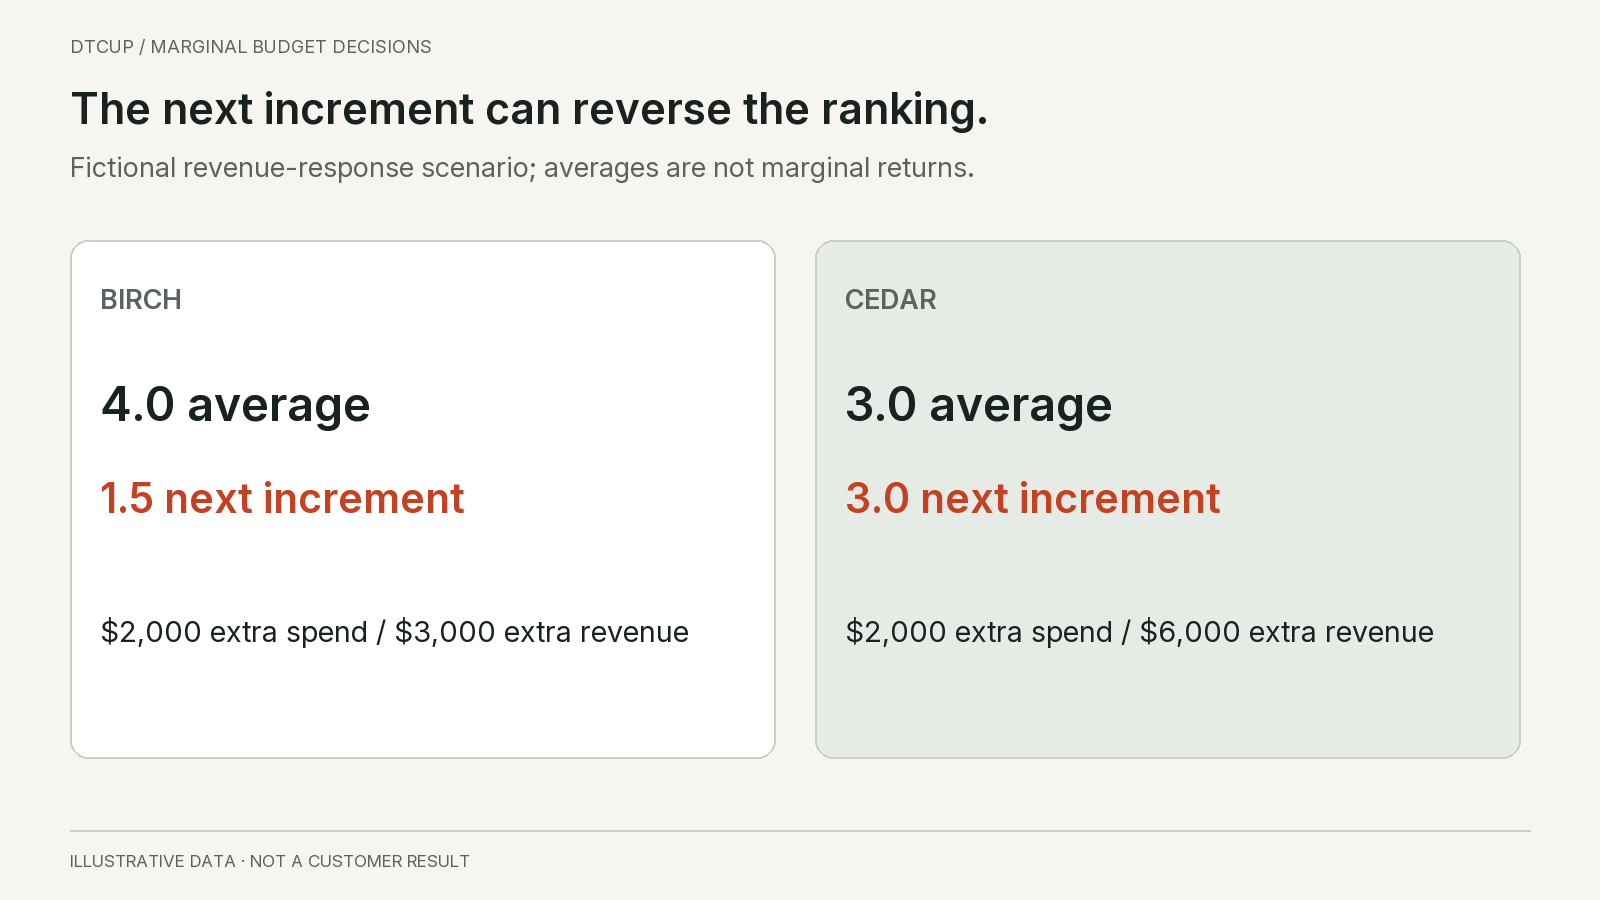
Return to Juniper Living with a separate fictional planning scenario based on assumed incremental net revenue, not the attributed totals above. At $10,000 spend, Channel Birch is estimated to generate $40,000 incremental revenue. At $12,000, the estimate is $43,000. The average revenue return at the initial level is four, but the additional $2,000 produces only $3,000 in this scenario: an incremental revenue return of one and a half.
Channel Cedar is estimated to generate $18,000 incremental revenue at $6,000 spend and $24,000 at $8,000. Its initial average return is three, below Birch’s four. Yet its proposed additional $2,000 produces $6,000, an incremental return of three. Ranking historical averages would select Birch; comparing these specific next increments would favor Cedar, before considering margin and constraints.
These numbers are invented to illustrate the distinction. In a real business, the response estimates need evidence and uncertainty. A difference between two consecutive weeks is not automatically a causal response curve because demand, pricing, promotions, competition and measurement may also have changed.
Google Meridian’s documentation distinguishes historical ROI, marginal ROI and response curves, and notes the risk of extrapolating beyond observed spending. Its model terminology does not necessarily mean accounting profit. Check the modeled outcome and assumptions before translating the result into a contribution-based budget decision.
Apply the margin of the incremental business
Continue the Birch and Cedar scenario. Suppose Birch’s additional orders are expected to retain thirty percent of net revenue as pre-marketing contribution, while Cedar’s additional orders retain forty percent. Birch’s $3,000 additional revenue creates $900 contribution before the extra $2,000 spend, leaving a negative $1,100 incremental contribution after media.
Cedar’s $6,000 additional revenue creates $2,400 pre-marketing contribution. Subtracting the extra $2,000 spend leaves a positive $400. Under these assumptions and before other change costs, Cedar’s proposed increment clears the media cost while Birch’s does not. That is a much more relevant comparison than their initial average revenue ROAS.
The break-even incremental revenue return is the reciprocal of the pre-marketing contribution rate in this simplified model. At forty percent, the extra revenue must be two and a half times the extra media spend. At thirty percent, it must be about three and one third times. This formula assumes the rate applies to the incremental orders and that no other incremental costs have been omitted.
A company may require a buffer above break-even for uncertainty, overhead funding or strategic priorities. That buffer should be an explicit business decision. Do not disguise it as a universal advertising benchmark. A target suitable for a high-margin replenishment product can be inappropriate for a bulky product with substantial delivery and return costs.
Check whether scaling changes the margin itself. Higher spending may bring customers from costlier shipping regions, favor discounted variants or create warehouse overtime. Conversely, a verified operational improvement may reduce variable cost. The next-spend calculation should describe the expected incremental mix rather than mechanically multiplying by last month’s blended margin.
For a reallocation, evaluate both the receiving and the losing side
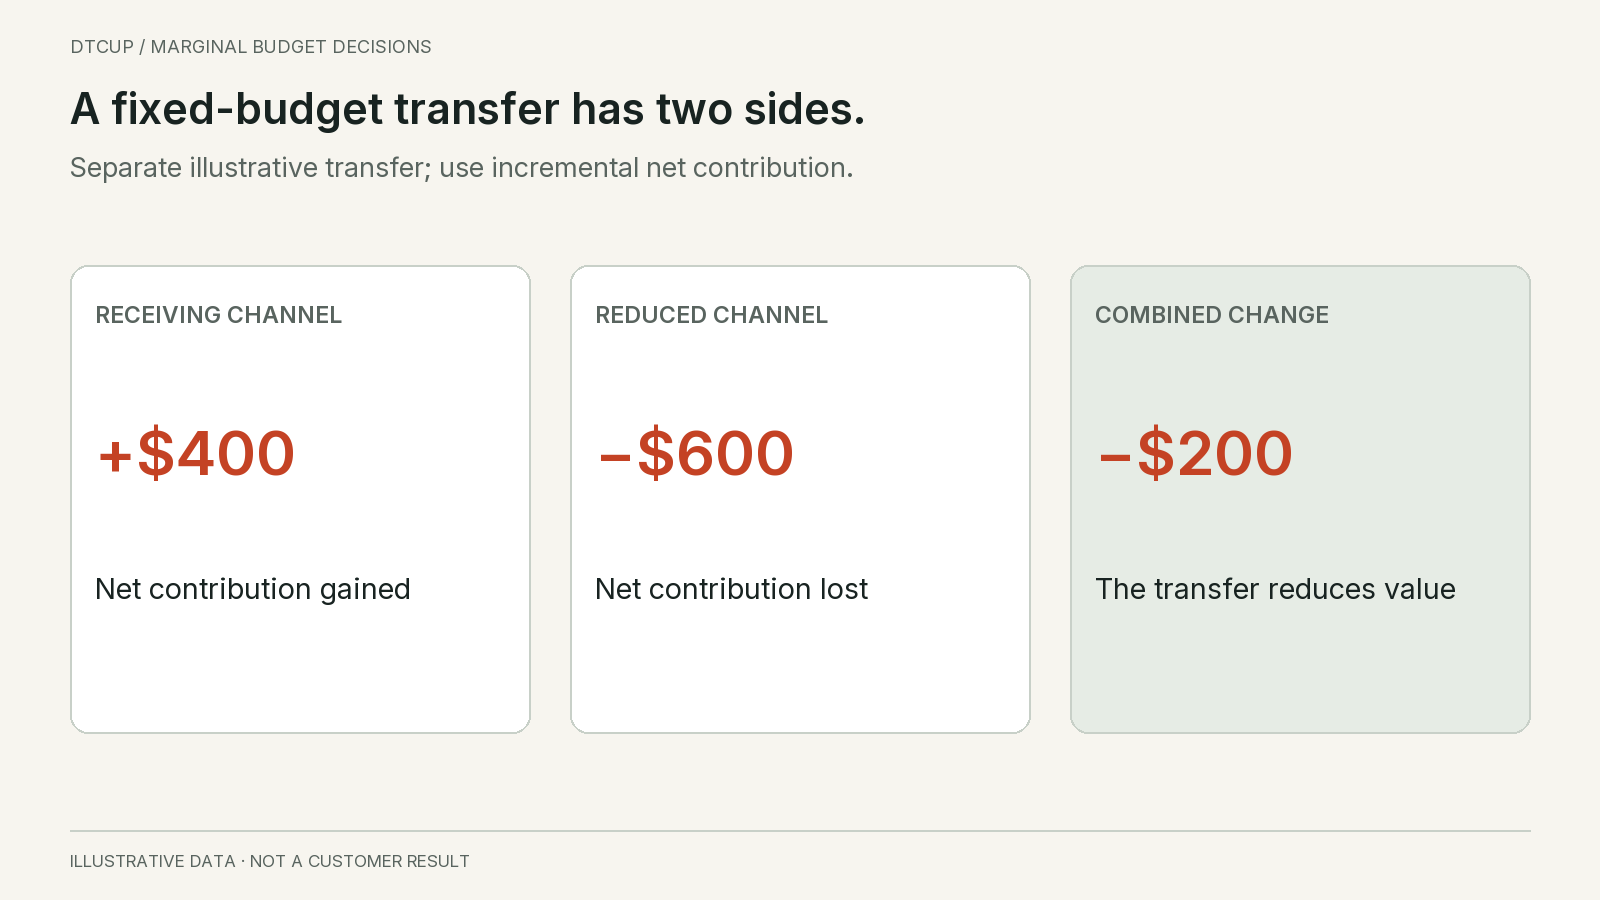
A fixed-budget transfer is not simply an expansion of the receiving channel. It also removes spend from somewhere else. The relevant comparison is the incremental contribution gained from the increase minus the contribution lost from the decrease, with the media budget changes and any additional costs treated consistently.
Suppose, in another explicitly separate scenario, moving $2,000 to Cedar creates the $400 net contribution gain calculated above. If removing $2,000 from Birch sacrifices $600 of net contribution that the retained spending would otherwise produce, the overall change is negative $200. Cedar’s expansion can look attractive on its own while the funded reallocation is unattractive.
Do not assume the return on removing spend is exactly the inverse of adding it. Response timing, audience learning, contractual minimums, campaign structure and operational constraints can make the paths differ. The analysis needs a credible estimate of the actual reduction being proposed, not a convenient reuse of the expansion estimate.
If the budget is truly flexible and cash permits, the question may instead be whether Cedar’s additional $400 is worth the uncertainty and other costs without reducing Birch. If cash is fixed, the opportunity cost of the funding source matters. The same receiving-channel evidence can therefore lead to different decisions under different business constraints.
Write the full before-and-after budget vector, not just the percentage increase in the favored channel. Check that it sums to the approved total and that every reduction has an owner. A recommendation that optimizes several channels independently can accidentally spend the same available budget more than once.
Check cash timing and inventory before approving profitable growth
A positive contribution estimate does not guarantee that the business can fund the plan. Inventory deposits, media payments, customer settlement, returns and supplier terms may occur at different times. A campaign can look profitable over the full cohort while creating a short-term cash requirement the business cannot safely absorb.
Map the significant cash events around the proposed increment. Which goods are already paid for? Which replenishment requires a deposit? When does media spend become payable? When are customer funds available, and what reserve is needed for expected refunds? Use actual commercial terms rather than assuming revenue arrives at the same moment as the dashboard conversion.
Inventory also limits the achievable outcome. If the promoted item cannot be replenished before the campaign demand, the response estimate may not be realizable. If selling the last units through one channel displaces a higher-contribution committed order elsewhere, that opportunity cost belongs in the choice. Marketing and inventory plans should refer to the same usable stock and dates.
Consider the reverse situation as well. Existing excess stock may make a lower-margin campaign useful if it improves recovery under a clearly defined objective. That does not mean every clearance sale is profitable acquisition. Separate the inventory recovery decision from the long-term customer acquisition strategy, and avoid teaching the reporting system that emergency markdown economics are the normal target.
The inventory commitment and cash guide explores the purchasing side. A complete budget decision connects the media plan to that operating reality. The financial constraint is not a distraction from marketing performance; it is part of whether the proposed performance can become a sustainable business outcome.
Include the costs that appear only when the plan changes
Media is often the easiest cost to see, but it may not be the only cost that changes. A new market can require localized creative, landing-page work and support coverage. A new channel may need a specialist or tracking integration. A higher volume can cross a fulfillment pricing threshold or require temporary staff.
Distinguish variable costs from step costs. A payment fee may rise with each transaction. A production shoot may be a one-time commitment that supports several campaigns. An additional support shift may become necessary only after volume crosses a threshold. Treating every cost as a constant percentage can misrepresent those discontinuities.
In the Cedar example, the $400 incremental contribution after media would not cover a new $900 creative production requirement if that requirement exists solely to enable the tested increment and has no other assigned benefit. The short-period result would be negative $500 before any later reuse value. If the creative supports several future periods, evaluate that investment separately with a realistic usage plan rather than making it disappear.
Do not allocate sunk costs to the next decision as though they can still be avoided. Equally, do not call every inconvenient expense sunk before it has been committed. The decision boundary matters: which costs change because the proposed action happens, and which remain under both alternatives?
Write the cost assumptions next to the recommendation. This helps marketing and finance resolve disagreements early. Many apparent disputes about channel quality are actually disagreements about whether creative, returns, overhead or operational capacity belongs inside the chosen horizon.
Use a range to decide whether the next step is a test or a rollout
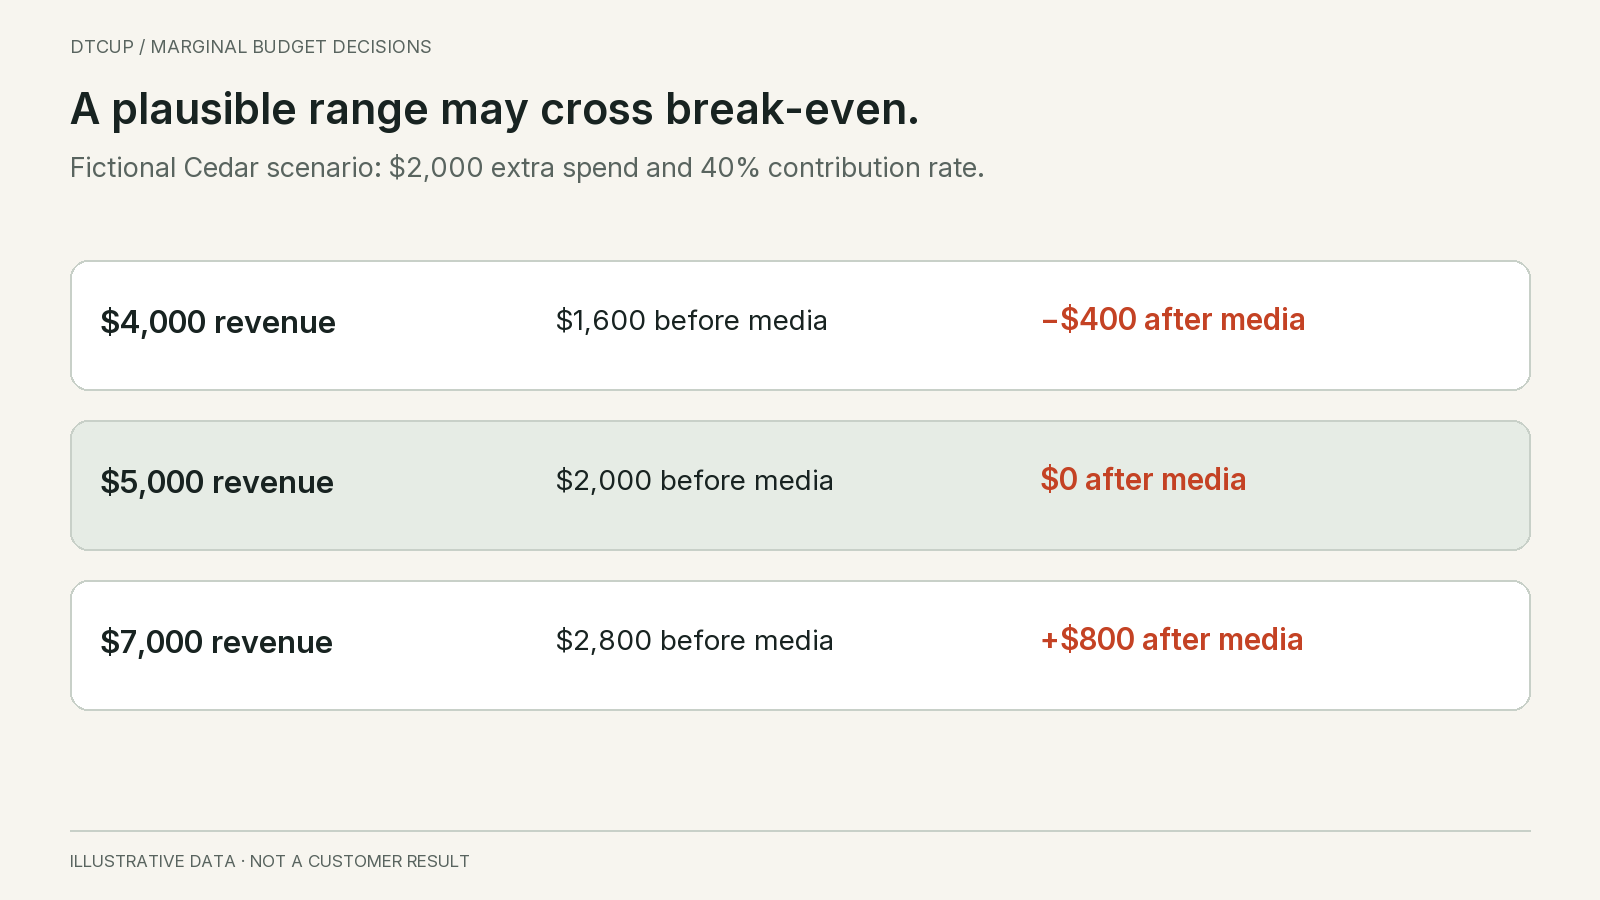
A single estimate can make a narrow advantage appear more certain than it is. Suppose Cedar’s extra $2,000 spend could plausibly generate between $4,000 and $7,000 incremental net revenue under the current evidence. At a forty percent contribution rate, the resulting contribution after media ranges from negative $400 to positive $800, before other incremental costs.
That range crosses break-even. The useful conclusion is not that Cedar is definitely profitable or definitely unprofitable. It is that the decision depends on uncertainty that may justify a bounded test, a smaller increment, stronger evidence or declining the change. The appropriate action also depends on the downside the business can tolerate and the value of learning.
Check whether the uncertainty comes from response, margin, timing or measurement. A return-rate estimate may mature with time. A weak causal design may require a different experiment. A missing cost field may be resolved through finance. Combining all uncertainty into one vague confidence label makes it harder to choose the next useful piece of work.
Do not select only the optimistic end of the range to justify expansion and then use the pessimistic end to explain disappointment. Record the range and decision rule before execution. If the plan is approved because the expected value is attractive despite a possible loss, say so and identify the authorized loss limit.
A smaller test is not automatically informative. It needs enough variation and observation to answer the intended question, while respecting operational constraints. If the feasible test cannot distinguish the outcomes that would change the decision, consider a different design or treat it as exploratory learning rather than a conclusive profitability test.
Design a test around the actual allocation question
A test of whether a channel produces any lift is not necessarily a test of the next budget increment. If the proposed decision is a modest increase from an established level, the evidence should be relevant to that range. A complete pause can answer a different question and may carry different operational consequences.
Define the treatment, comparison, outcome, observation period and important exclusions before launch. Keep the commercial value basis consistent with the decision. If refunds materially affect contribution, an early purchase-day report may be insufficient. If effects persist after exposure, the observation plan should reflect that rather than declaring a winner at the first convenient date.
Record promotions, inventory constraints, price changes, site releases and other campaigns that could affect interpretation. A valid design may account for some of them; others may invalidate the intended comparison. Do not repair a weak result by adding an explanation after seeing which direction it moved.
Where a controlled experiment is impractical, use the strongest feasible evidence and state its limitations. A phased change, a comparable market analysis or a modeled scenario can inform a bounded decision, but it should not be labeled equivalent to a randomized estimate merely because it has a chart and a percentage.
The result should return to the original choice. Did the evidence support increasing, reducing, holding or testing further within the stated range? If the outcome is inconclusive, say which uncertainty remains and whether another test is worth its cost. “More data needed” should have a purpose and an expiry, not become a permanent avoidance of a business decision.
Use future customer value carefully
A company may accept a lower first-order contribution to acquire customers expected to return. That can be rational, but only if the future contribution estimate is credible and the cash requirement is acceptable. Revenue-based lifetime value can exaggerate the benefit when repeat orders also carry product, fulfillment, discount and service costs.
Separate observed repeat contribution from forecast future contribution. Define the customer cohort, acquisition date, eligible repeat events and observation age. A recent cohort has had less time to repeat. Comparing it directly with an older cohort can make the newer channel look worse or encourage an unsupported projection to compensate.
Account for the marketing required to generate the repeat orders. If retention campaigns create additional spend or discounts, include those costs in the relevant future contribution. Do not count the same repeat value as fully caused by both acquisition and retention simply because separate platforms claim it.
Apply a realistic horizon and uncertainty range. A lifetime estimate extending far beyond observed behavior should not become unlimited permission to buy customers at a loss today. The business needs to understand when cash might return, how much confidence exists and what would stop the strategy if the expected repeat behavior fails to appear.
For practical decisions, I would show first-order contribution, observed cohort contribution to date and the forecast extension separately. That allows the founder to see whether the budget case rests on established behavior or an optimistic future. It also makes later review fairer because the original assumption remains visible.
Avoid adding channel scenarios that cannot coexist
Channels can influence one another. Prospecting may increase later branded search. Email may capture demand created elsewhere. Changing several budgets at once can alter the mix of paths and customers. Adding independent channel forecasts can therefore overstate the combined result if each estimate assumes the other channels remain unchanged.
Check the assumptions of any response model or experiment before combining its recommendations. Does it estimate one channel’s change with all others fixed? Does it cover interactions or only an additive approximation? Does the proposed budget move remain inside the observed range? These questions determine what the resulting total means.
When the evidence is weak, prefer a limited, interpretable change over a broad reshuffle that makes every future movement ambiguous. That does not mean never changing several channels. It means the implementation should preserve enough evidence to understand whether the combined plan worked and which assumptions require revision.
Use the business-level outcome as a check. If every channel dashboard improves while total contribution deteriorates, investigate measurement, cost, mix and overlap. Platform-reported efficiency can rise because credit shifts toward easier-to-observe customers rather than because the business gains more valuable demand.
Keep channel participation reports separate from exclusive value allocation. The participation and fractional credit guide explains why overlapping influence views cannot simply be summed. Budget planning should inherit that discipline instead of treating several claims on the same order as several different revenue opportunities.
Do not optimize the ratio at the expense of the objective
Reducing spend can raise average ROAS while reducing total contribution. Increasing spend can lower the average while adding profitable volume. Neither direction is automatically good or bad. The decision depends on the marginal economics and the business objective, not whether the ratio moves upward.
A team rewarded only for a high average may underinvest in profitable growth and favor customers who would have purchased anyway. A team rewarded only for revenue may overinvest in low-margin demand. Balanced accountability requires the chosen economic outcome, the evidence supporting causality and the operating constraints to remain visible together.
Be careful with blended measures as well. A blended revenue-to-media ratio can provide a useful company-level trend, but changes in organic demand, repeat customers, promotions and product mix can move it without a corresponding change in paid-media effectiveness. It is a diagnostic view, not a complete allocation rule.
Where data is insufficient for precise marginal estimates, a simple disciplined process can still improve decisions: reconcile the value, identify the plausible next increment, compare cost and operational constraints, limit the exposure and review the result. False precision is not the only alternative to intuition.
The aim is to make the reasoning inspectable. A colleague should be able to explain why the proposed spend differs from the current plan, what evidence supports it and which assumption could make it wrong. That is more useful than a target ratio selected because it resembles an industry benchmark.
Use a budget review record that finance and marketing can share
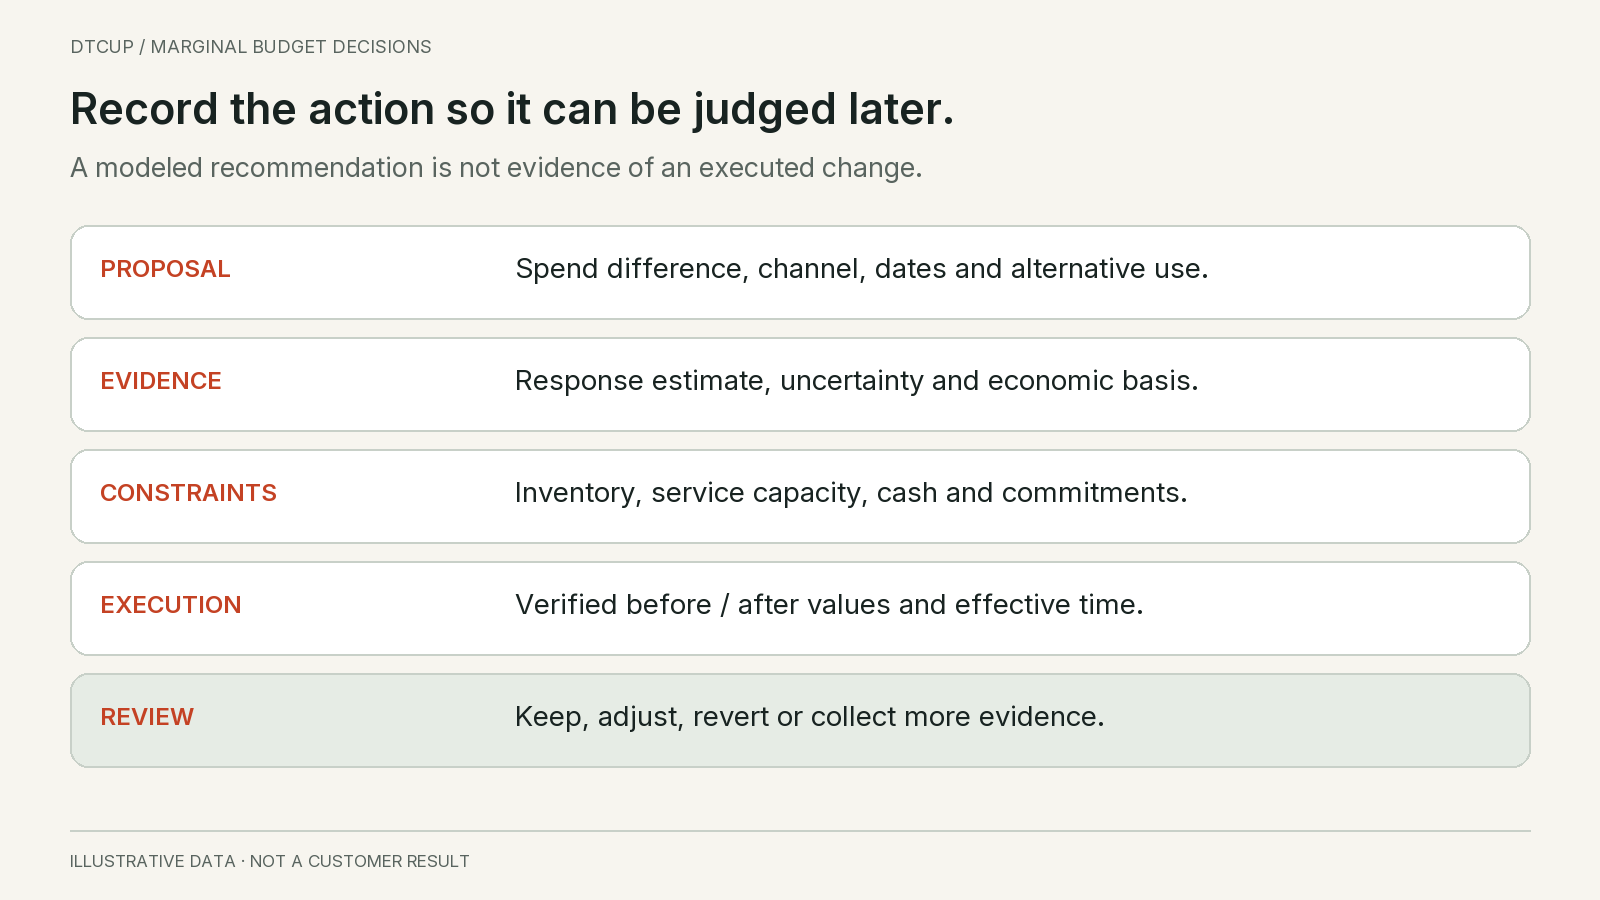
The record should begin with the exact proposed change and the objective. Attach the current and proposed spend by activity, the commercial outcome definition, the response evidence, the incremental cost assumptions, the cash timing and the operational constraints. Keep the source dates and model or experiment version so the estimate can be reproduced.
Next, show the central case and a decision-relevant range. Explain the downside, the planned limit and the review trigger. If the case depends on a margin improvement, a stock receipt or a creative release, make that dependency explicit. A budget approval conditional on a receipt should not be treated as unconditional permission to spend before the goods are usable.
Record the execution separately from the recommendation. A proposed increase, an approved increase and a saved platform setting are different states. Verify what actually changed and when before evaluating the result. Otherwise a disappointing outcome may be attributed to a plan that was never implemented as intended.
At review, compare the observed result with the assumptions and note what else changed. Decide keep, adjust, revert or insufficient evidence. The last outcome should identify the specific missing information and next review, not imply that the original recommendation has been validated.
Preserve the record even when the change works. Successful decisions are useful evidence about the range in which a response estimate was reasonable. They should not become a universal rule to scale indefinitely. The next increment is a new decision, and the business may be closer to a different margin, audience or inventory constraint.
Build a small allocation exercise before trusting an optimizer
A simple exercise can reveal the logic an automated recommendation should preserve. Consider a separate fictional planning case with an established base budget that is already approved and an optional $5,000 expansion pool. The team evaluates additional spending in $1,000 blocks. The estimates below are incremental contribution after media and the variable costs included in this scenario. They are not revenue and are not observations from an advertising account.
For Channel Alpha, the first additional block is estimated to add $500 contribution, the second $350, the third $100 and the fourth negative $100. For Channel Beta, the corresponding blocks add $450, $250, $50 and negative $200. Each block assumes the previous blocks in that channel have already been taken; the team cannot buy the third block while skipping the first two.
Under these deterministic assumptions, the five most valuable feasible blocks are Alpha’s first, Beta’s first, Alpha’s second, Beta’s second and Alpha’s third. The expansion allocates $3,000 to Alpha and $2,000 to Beta, with an estimated contribution gain of $1,650. The sum is $500 plus $450 plus $350 plus $250 plus $100. This is a local planning exercise around the existing base, not proof that either channel deserves the same percentage of the entire annual budget.
Now add a real business constraint. Suppose Alpha’s third block would require selling inventory that is not available within the campaign period. That block is infeasible even though its modeled contribution is positive. The team could choose Beta’s third block instead, allocating $2,000 to Alpha and $3,000 to Beta for an estimated $1,600 contribution gain. Alternatively, it could retain the last $1,000 if the $50 estimate is too uncertain to justify spending it.
The distinction between a maximum and a mandatory budget matters. An optional pool does not require the business to spend every dollar. A fixed contractual commitment may impose a different problem, but that constraint should be stated explicitly. An optimizer instructed to allocate the full amount can recommend a weak final block simply because it has no permission to leave cash unspent.
Add uncertainty next. If Beta’s third block has a plausible contribution range from negative $180 to positive $280, the central estimate of $50 is a fragile reason to scale. The decision could be a capped learning test with a clear loss limit, or no expansion until stronger evidence appears. Calling the entire $5,000 allocation “optimal” without displaying this uncertainty would overstate what the exercise establishes.
Finally, check combined assumptions. The block estimates may have been calculated while other channels remained at their initial spend. Moving both channels could alter the audience mix or competitive cost. The simplified arithmetic is useful for teaching the allocation logic, but a real plan must evaluate whether those blocks can coexist. The purpose of a small manual exercise is to expose assumptions, not to replace a validated response model with invented precision.
Give learning spend a different success condition
Some spending is justified mainly because it reduces an important uncertainty. A new creative format, market or audience may not yet have enough evidence for a stable response estimate. If the business chooses to learn, create an explicit experiment budget rather than quietly lowering the profitability standard for the whole channel.
The learning case should name the future decision it could change. For example, the test may determine whether a new audience can support a contribution-positive acquisition range before the brand commits to a larger stock order. Define the information needed, the maximum acceptable loss and the operational exposure. A test without a decision attached can become a recurring expense that is always described as early learning.
Evaluate whether the expected information is worth the cost. If the result cannot distinguish between the actions the team is considering, a smaller test may simply produce another ambiguous chart. It may be better to improve tracking, verify costs, narrow the question or wait for a more suitable comparison. Activity is not automatically learning.
At the end, record both commercial and informational outcomes. The test may lose money within its approved limit while providing useful evidence that prevents a much larger bad commitment. It may also produce positive short-term contribution without answering the intended question because the audience or execution differed from the plan. Those are different results and deserve different next steps.
Keep this budget separate from the ongoing allocation model until the evidence supports integration. Otherwise exploratory spending can distort the historical average used to judge established activity, while established activity can subsidize an experiment whose losses are never visible. Clear separation makes the business more willing to test because it knows what it has authorized and when the experiment will end.
Before approving a transfer, check the effective date of every input. A contribution rate calculated before a supplier price increase does not describe the next batch. A response estimate from a holiday promotion may not describe ordinary trading. Put the cost version and trading conditions beside the recommendation, then ask whether either will change during the spending period. This small check often matters more than another decimal place in the allocation output: the arithmetic can be correct while the proposed action belongs to a different commercial situation.
Questions about contribution-based budget allocation
Is the highest-ROAS channel the safest place to increase spend?
Not necessarily. Its average may describe earlier efficient spending, existing demand or a product mix that will not persist. Evaluate the proposed increment, the relevant contribution rate and the evidence for additional demand. Also check whether fulfillment and cash can support the increase.
Can we use a break-even ROAS target?
Yes, as a clearly defined economic screen. Under a simple model, the reciprocal of the pre-marketing contribution rate gives a break-even incremental revenue return. The calculation is only as good as the revenue basis, margin and incremental-cost assumptions. It does not establish that attributed revenue is incremental.
Should we always spend until marginal return reaches break-even?
No. Uncertainty, cash reserves, operational capacity, fixed commitments and the value of alternative investments may justify a higher threshold or a lower spending level. A modeled optimum is conditional on its inputs and constraints. The business remains responsible for deciding whether those conditions are credible.
What can a small brand do without enough data for advanced models?
Begin with reconciled orders and costs, explicit budget changes, bounded tests and a record of promotions and operational changes. Use estimates honestly and avoid channel-level precision the evidence cannot support. Better decision discipline can create value before a sophisticated model becomes appropriate.
The next dollar deserves its own argument. Historical attribution helps describe where credit went, but budget allocation asks what will change, what that change is worth and whether the business can carry it. Keeping those questions separate makes growth decisions more practical and much harder to misread.
Sources
Still have a question?Ask the DTCUP Community ↗