
Stop Optimizing Ticket Deflection: Measure Whether Customers Got Help
A closed conversation can hide unfinished work. Build a support outcome ledger that follows repeat contacts, unknown results and human handoffs, then uses the evidence to choose a practical repair.

7 years of experience building and operating brand websites, specializing in website development, paid advertising and SEO. Built a brand website from launch to US$10 million in annual sales.
The Short Answer
Follow one customer issue across conversations and channels. Keep interaction labels, answer evidence and later outcomes separate. Report evidenced resolution alongside unknown and pending cases, verified repeats, completed handoffs and total operating work; no human involvement alone does not establish successful automation.
Key takeaways
- Define the customer task and its required evidence before counting resolution.
- Link repeat conversations conservatively into issue episodes.
- Keep unknown outcomes visible rather than assuming success or failure.
- Follow handoffs through accountable acceptance and completion.
- Compare similar workloads with equal follow-up time.
- Use the weekly scorecard to select a specific repair and owner.

A support dashboard can improve while customers have a harder time getting help. The assistant answers quickly, fewer conversations reach a person, and the reported resolution rate rises. Yet customers are opening a second chat, emailing a different team or quietly giving up. The business has reduced visible tickets without necessarily reducing unresolved problems.
I would keep ticket deflection as a routing observation and stop treating it as the main verdict on AI support. The stronger question is whether customers completed the task they came to do, with an acceptable amount of effort, and whether unresolved work reached someone who could finish it. That requires following issues beyond the first conversation.
This guide builds an outcome ledger for Alder Goods, a fictional home accessories brand. All counts, policies and examples are constructed for explanation. They are not DTCUP customer results or industry benchmarks. The aim is to show how a support lead can reconcile apparently successful automation with the work that happens afterward, without pretending every silent customer is either satisfied or unhappy.
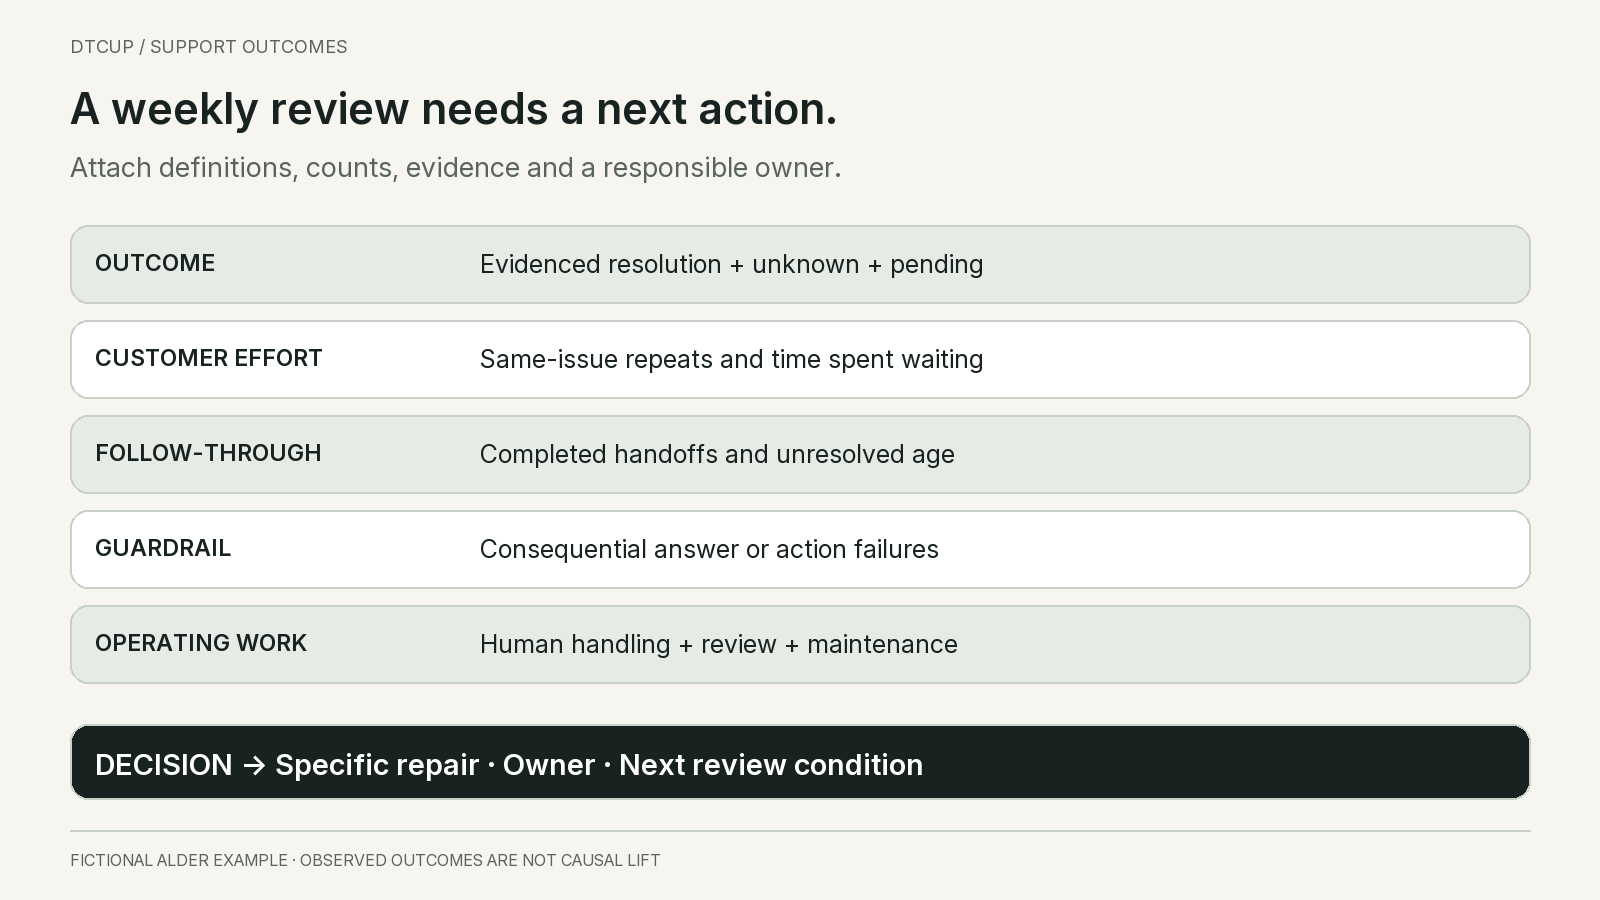
The final deliverable is a weekly scorecard with a small number of defensible measures: evidenced resolution, repeat contact, completed handoffs, unresolved age and total operating work. Each number has a denominator and an observation window. More importantly, each points to a decision the team can make.
1. Define the customer job before defining resolution
“The assistant replied” is an event. “The customer received the help they needed” is an outcome. The gap between them depends on the task. A question about a public care instruction might be resolved by an accurate explanation. A request to change a delivery address requires a permitted change in the order system, or a clear explanation that the change cannot be made and what options remain.
Start with a manageable set of issue families. Alder uses product questions, order status, order changes, returns and account access. The families do not need to capture every nuance. They need to distinguish work with different evidence and risk. An order status answer and an account recovery operation should not share the same acceptance test simply because both appear in chat.
For each family, write what a satisfactory outcome looks like from the customer’s perspective. For order status, it may be the latest verified state, the relevant expected next event and an honest explanation of uncertainty. It is not necessarily a delivered parcel. Support can explain a shipment correctly while delivery remains pending. Conversely, a reassuring delivery date invented by the assistant is not a resolved support question.
Separate the support task from the underlying operational task. A refund request can be accepted and explained correctly while the payment is still processing. If the customer’s question was whether the refund had already arrived, acceptance alone does not answer it. The same database event can be sufficient evidence for one question and insufficient for another. Record the question the customer actually asked.
Define prohibited outcomes as well. A response that exposes another person’s order, promises an unavailable exception or claims an action without confirmation cannot pass merely because the customer says thanks. Customer satisfaction and factual correctness are related, but neither substitutes for the other. The customer may not yet know that the answer is wrong.
Keep these contracts short enough for supervisors to apply consistently. “Correct approved explanation, relevant to the stated issue, no unsupported promise, clear next step” is more usable than a long collection of subjective adjectives. For tasks involving actions, add verified authorization and a confirmed final state. Link the contract to the evidence needed to check it.
The practical benefit is a shared interpretation. When an engineer says the tool succeeded, an agent says the ticket is closed and the customer says nothing changed, the team can identify which part of the task remains incomplete. Without that distinction, each department can defend its own green dashboard while the customer continues waiting.
2. Count customer issues, not just chat windows
A customer can open three conversations about one damaged item. Another customer can ask two unrelated questions in one conversation. Conversation counts are convenient because support platforms generate them automatically. They are not always the right unit for evaluating whether problems were solved.
For the weekly review, create an issue episode: a bounded record of one customer’s attempt to complete one support job. Retain the underlying conversation identifiers. If a customer returns about the same damaged item, attach that contact to the existing episode when the evidence supports the connection. If they later ask about a different purchase, create a new episode.
Alder uses an internal customer identifier, order identifier when relevant, issue family and reviewer-confirmed relationship between contacts. None of those fields alone is sufficient. Two people can contact support about the same shared order, and one person can have several simultaneous order problems. A matching email address is useful evidence, not permission to merge every contact into one case.
Start with conservative linking. Mark uncertain pairs for review rather than forcing a match. Keep an explicit count of unlinked contacts. A cross-channel repeat rate based on verified account records should be described as a rate within that observable population. It should not be advertised as covering anonymous visits, disconnected phone systems or messages that cannot be reliably matched.
Give the episode an opening time and a reason for closure. Preserve the times of every conversation, answer, handoff, action and later contact. An episode can reopen when new evidence shows the original issue remains unresolved. Do not overwrite the first answer with the latest status; the sequence is what reveals whether automation reduced work or merely postponed it.
The ledger should also distinguish planned follow-up from avoidable repeat contact. If an agent asks a customer to send a photograph and the customer returns with it, that is a continuation of the agreed process. If the customer has to repeat the whole complaint because the assistant discarded the context, that is additional effort caused by the support experience.
There is no universal episode window. A delivery enquiry may need several days of follow-up; a technical setup problem may need longer. Choose windows around the task and report them. A seven-day metric is a seven-day observation, not a lifetime guarantee. If the business changes the linking rule, preserve the old definition so the apparent improvement is not mistaken for better service.
3. Separate confirmed, inferred and unknown outcomes
Resolution labels differ between products. For example, Intercom’s documented Fin outcome definition distinguishes a customer’s positive confirmation from an assumed resolution when the customer leaves after an answer without requesting more assistance. Those are useful platform definitions, but they are different evidence states. A business scorecard should retain that distinction instead of translating both into independently verified success.
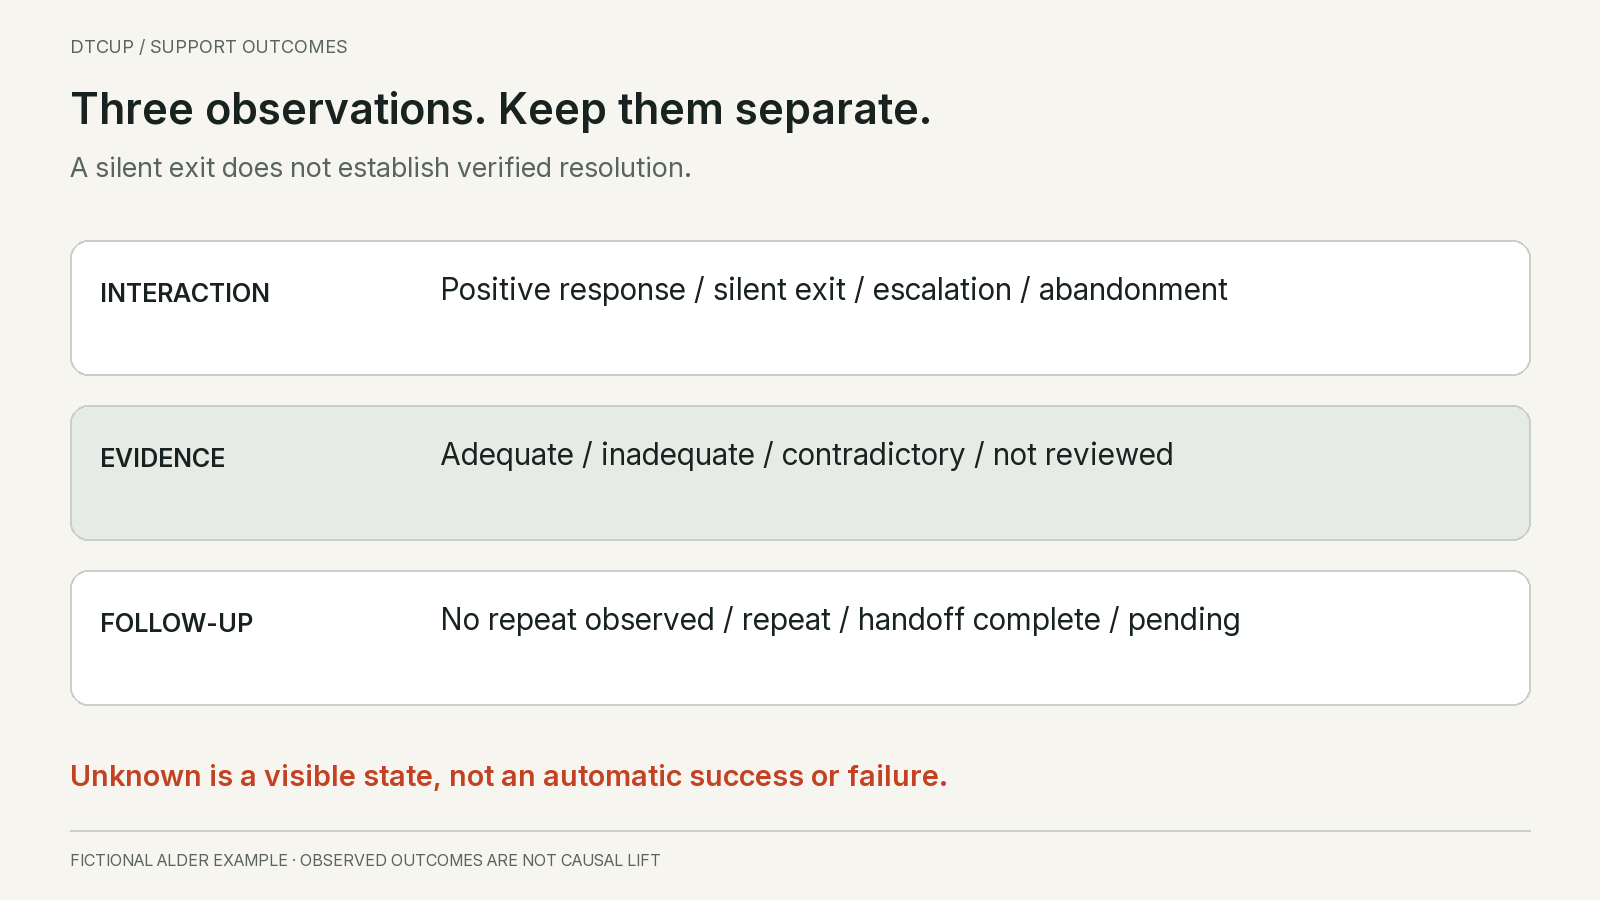
Alder records three dimensions rather than one overloaded status. The first is the observed interaction outcome: positive response, silent exit, escalation or abandonment before an answer. The second is the evidence judgment: adequate, inadequate, contradictory or not reviewed. The third is the follow-up state: no observed repeat yet, same-issue repeat, completed handoff or still pending.
These dimensions can disagree. A customer can confirm an answer that contradicts policy. A customer can leave silently after receiving a perfectly adequate care instruction. An escalation can be the correct response to a request outside the assistant’s authority. The ledger must allow these combinations; otherwise its categories will force analysts to hide important information.
Use “evidenced resolution” for cases that satisfy the task contract using the available evidence. That may include a correct answer plus meaningful confirmation, a verified operation and appropriate explanation, or a reviewed human resolution. Describe the evidence standard. Do not imply that every resolved case needs a survey response, or that a survey response alone establishes correctness.
Keep unknown outcomes visible. They are a measurement limitation and often a product research opportunity. They are not automatically failures. They are also not automatically successes that can be added to a savings claim. If half the customer journeys end without enough evidence, the next investment may be better outcome instrumentation rather than a different language model.
For an informational question, a lightweight optional confirmation may help. For an action, inspect the operation result. For a troubleshooting task, offer an explicit “still not working” route. Match the evidence to the job instead of forcing every customer through a satisfaction question that adds friction but little diagnostic value.
Preserve the distinction between the vendor’s reporting measure and the business’s measure. Both can be valid for their stated purpose. The problem begins when a billing outcome, a conversation label and a customer success claim all receive the same name in a management presentation.
4. Reconcile one complete cohort before building a dashboard
Consider one fictional week in which Alder receives 1,000 eligible issue episodes. Eight hundred engage with the assistant and 200 go directly to human support. The business observes every episode for seven days after its opening time. This equal follow-up is important: Friday’s customers must not receive only two days of observation while Monday’s receive six.
At the first exit from the AI conversation, 240 customers give a positive confirmation, 360 leave silently after an answer, 160 are escalated and 40 leave before receiving an answer. These mutually exclusive first-exit categories add to 800. They describe what happened at that point, not the final outcome of the episode.
A simplified dashboard might combine the 240 confirmed and 360 silent exits, then report 600 out of 800, or 75%, as resolved without an immediate handoff. That is a recognizable interaction statistic. It does not establish that 600 customer issues were durably resolved. The next seven days change the picture.
Within the observation window, 24 of the 240 positively confirmed episodes and 90 of the 360 silent exits return with the same unresolved issue. In this constructed example, all 114 are verified repeats and all subsequently receive human attention. They are not additional new episodes. Counting them as new demand would hide the relationship to the original AI interaction.
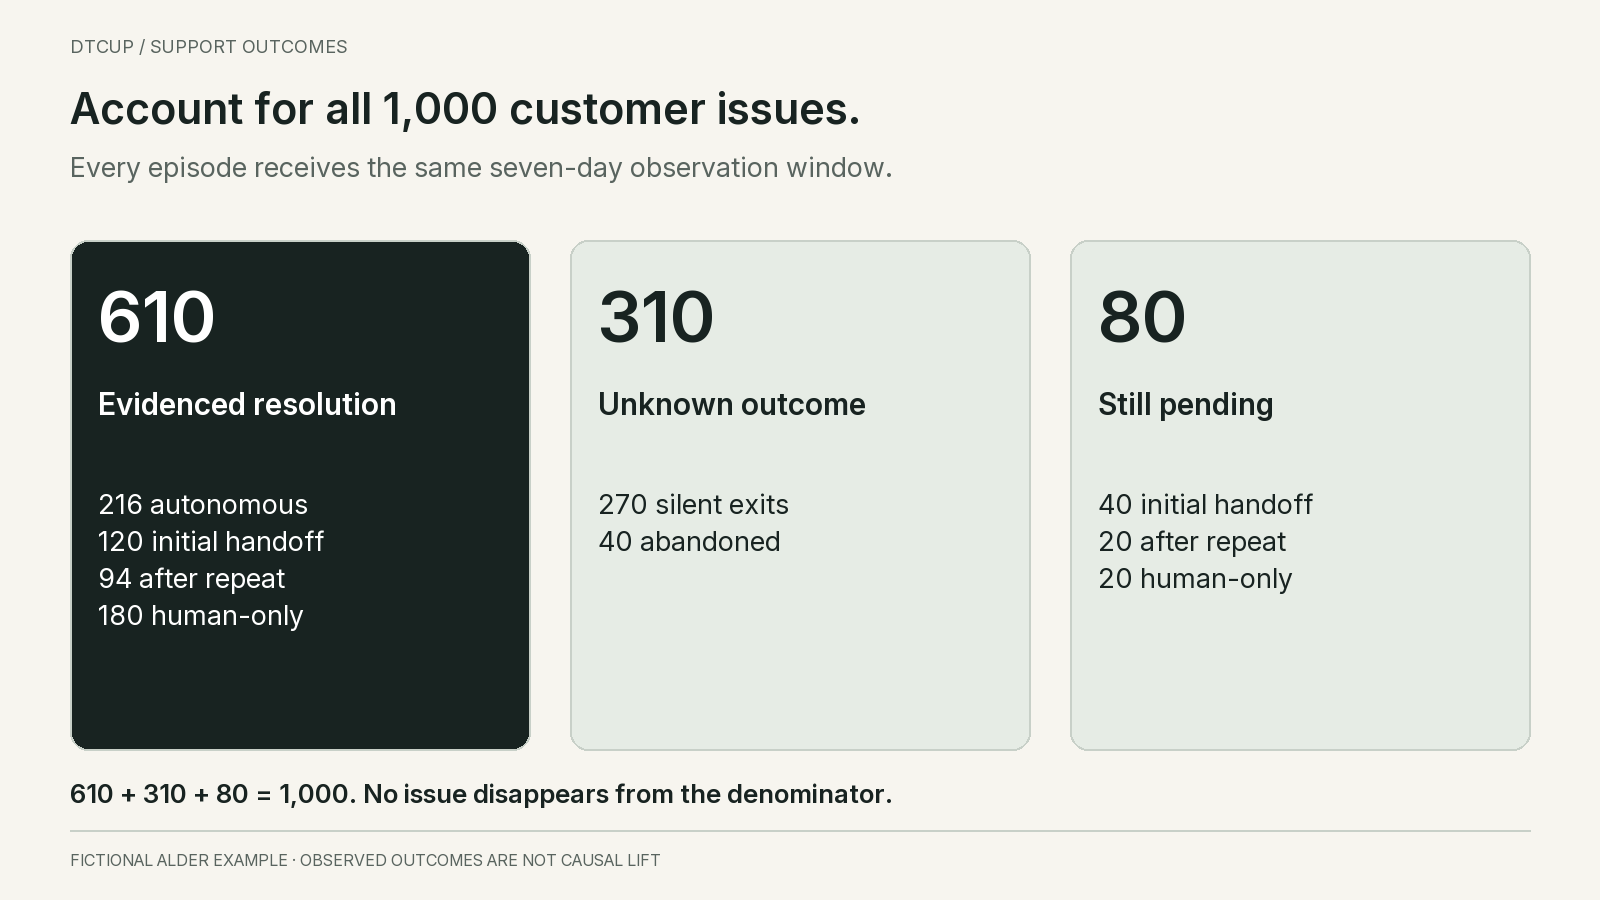
That leaves 216 positively confirmed episodes without an observed repeat, 270 silent exits without an observed repeat and 40 abandoned episodes. The 216 also pass Alder’s task evidence check in this example. The silent and abandoned groups remain unknown because the available records do not establish their outcomes. Real operations will often review only a sample; this worked ledger assumes the stated evidence is available.
The original 160 escalations produce 120 evidenced resolutions by day seven, with 40 still pending. The 114 repeat episodes produce 94 evidenced human resolutions, with 20 pending. The 200 direct-to-human episodes produce 180 evidenced resolutions and 20 pending. The numbers now reconcile across the whole support system rather than stopping at the assistant’s first response.
The total is 610 evidenced resolutions: 216 autonomous, 120 after an initial escalation, 94 after a repeat contact and 180 human-only. Another 310 are unknown: 270 silent exits and 40 abandoned episodes. Eighty are still pending. The three groups add to the original 1,000 episodes. This reconciliation is the foundation of the scorecard.
The business can report 61% evidenced resolution across the complete cohort by day seven. Within AI-engaged episodes, 430 of 800, or 53.75%, reached evidenced resolution through either AI or later human help. Autonomous evidenced resolution is 216 of 800, or 27%. That last number is deliberately conservative; it does not assert that every unconfirmed silent exit failed.
Notice what the ledger does not say. It does not prove that human support would have resolved more or fewer cases without AI. It does not assign causal blame for every repeat. It does show that a 75% first-exit success label and a 27% evidenced autonomous outcome measure describe very different things. A manager should know which one is being used before approving expansion.
5. Measure repeat contact without punishing legitimate follow-up
Repeat contact is useful because it exposes work that an early resolution label can miss. It is also easy to misuse. Customers may return because the parcel is genuinely delayed, because a new fact appeared, because the business requested documentation or because the original answer was confusing. Those are different operating problems.
For Alder’s initial 600 apparent AI resolutions, the verified same-issue repeat rate is 114 divided by 600, or 19%, within seven days. The denominator is the first-exit apparent-resolution group, not all AI conversations or all customers. Within positive confirmations the rate is 24 divided by 240, or 10%. Within silent exits it is 90 divided by 360, or 25%.
Those differences justify investigation, not a universal claim about silence. Review the underlying tasks. Silent exits might contain more difficult return disputes, more anonymous visitors or a mobile interface that makes feedback inconvenient. The next useful step is to compare similar issues with similar evidence coverage before attributing the entire difference to answer quality.
Add a reason code after review: wrong information, incomplete next step, failed operation, lost context, planned continuation, external delay or uncertain relationship. Permit more than one contributing reason but select one primary cause for the weekly action list. A customer who contacts support again because a promised refund operation never executed should not be grouped with someone who was explicitly asked to return after a carrier update.
Measure elapsed time to repeat as well as the total rate. A second contact within ten minutes often suggests immediate confusion or an unusable answer. A contact six days later may reveal a broken promise or an unresolved operational dependency. Neither interpretation is automatic, but the timing helps the reviewer ask a better question.
Track additional effort in concrete terms. Count repeated explanations, duplicated authentication steps and channel switches when observable. A customer may eventually get a correct answer but spend twenty minutes retelling the story. That journey can satisfy a narrow final-resolution metric while still representing poor service.
Do not hide repeats by resetting the episode identifier when a human takes over. Do not count every message as another contact. Define the boundary between messages within an ongoing exchange and a renewed attempt after apparent closure. Apply it consistently to AI and human workflows so one channel does not benefit from a more convenient counting rule.
When a repeat is confirmed, update the episode’s current outcome and preserve the earlier snapshot. The weekly report can then say that an initial result was revised after follow-up. Silent historical revisions make it difficult to explain why last week’s number changed and encourage teams to distrust the entire dashboard.
If the business also reports first-contact resolution, write a separate definition for it. A case resolved after an avoidable second contact can count toward eventual resolution but should not count as first-contact success. A case correctly routed to a specialist during the original exchange may satisfy the customer’s task without another customer-initiated contact, depending on the stated rule. Decide whether the metric follows the first conversation, first team or first customer attempt; those boundaries produce different results.
Keep eventual resolution and first-contact resolution beside each other. The first tells the team whether the problem was finished within the observation window. The second helps reveal avoidable effort along the way. Optimizing only the second can discourage useful follow-up, while optimizing only the first can conceal an exhausting journey. The task contract and contact history make both interpretable.
6. Follow the handoff until someone actually owns the problem
An assistant can do the right thing by involving a person. A low escalation rate is therefore not an unconditional sign of quality. If the system avoids escalation by answering beyond its authority, the apparent efficiency is dangerous. If it escalates appropriately but the receiving queue never acts, the customer still lacks help.
Measure a handoff as a sequence: requested, routed, accepted, first meaningful human response and completed outcome. An automatic “we received your message” acknowledgement is not the same as acceptance by an accountable team. A queue identifier establishes a destination; it does not prove that anyone is working on the issue.
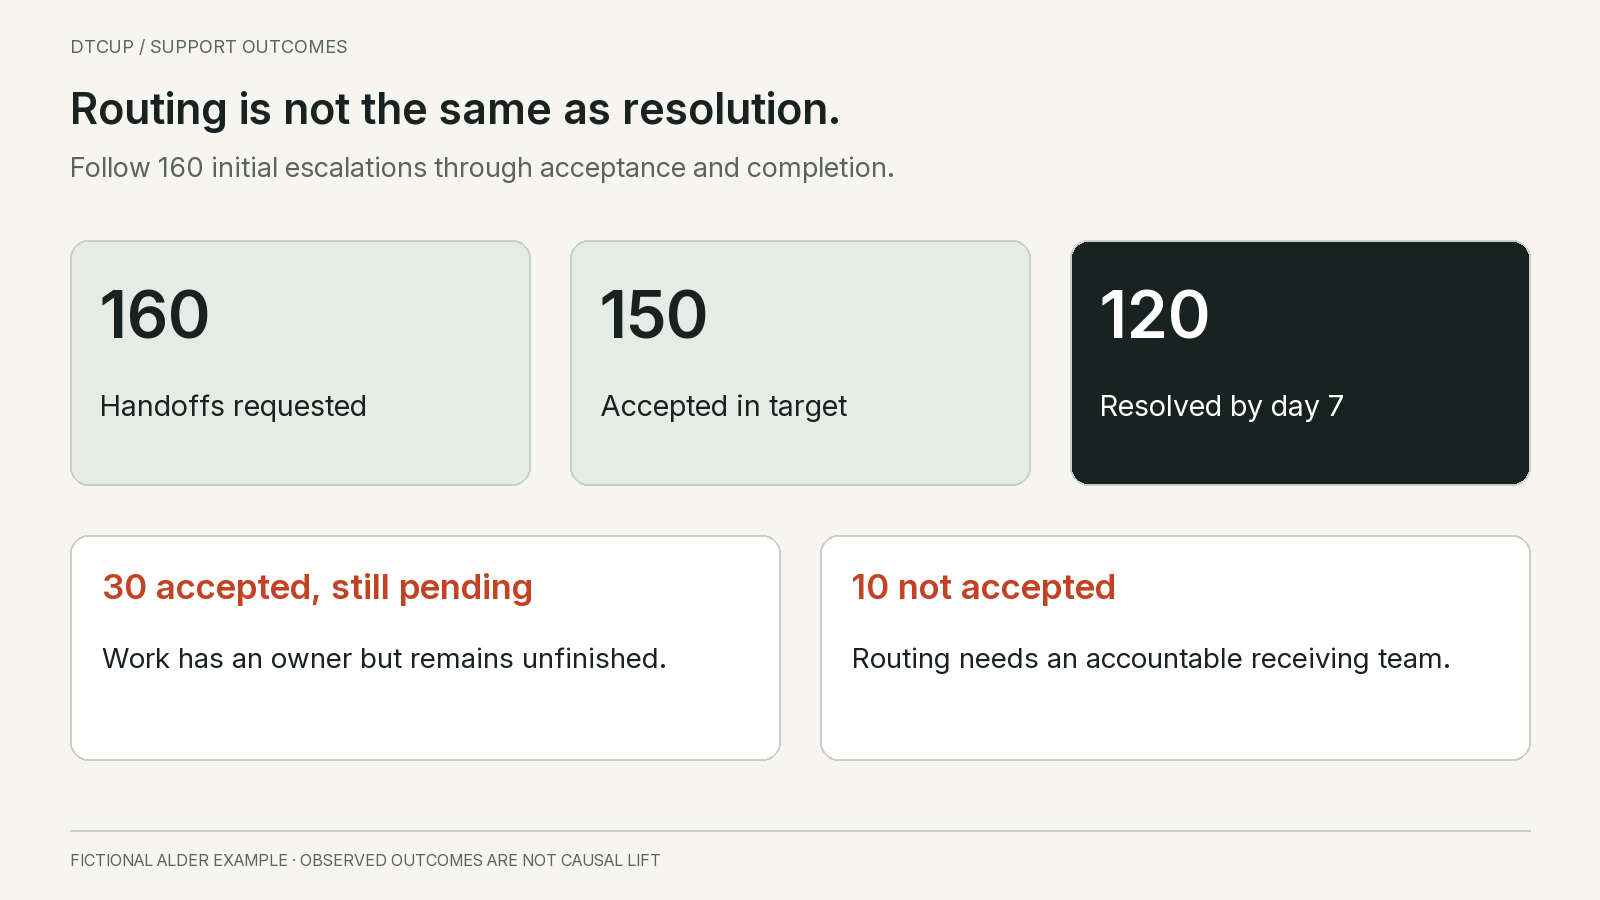
In Alder’s 160 initial escalations, 150 are accepted by a receiving team within the example’s stated service target. Ten are not. By day seven, 120 have evidenced resolution and 40 remain pending. Of those pending cases, 30 were accepted but unfinished and ten were not accepted. Acceptance is 93.75%; completed resolution is 75%. Both measures matter.
Keep the timing targets specific to the operating schedule. A four-business-hour commitment is different from four elapsed hours. Customers need the actual expectation, including weekends or unavailable teams. The scorecard should use the same clock as the promise rather than making performance look better through an unannounced calendar change.
Review handoff completeness with a small checklist. Did the receiving person get the issue summary, verified identity state, relevant order or product reference, evidence already checked, attempted actions and the exact unresolved question? Missing context often creates another round of customer explanation even when routing itself succeeds.
Do not include sensitive information merely to make a handoff look complete. Pass only what the receiving role is permitted to access and needs for the task. The quality measure is whether the next person can act appropriately, not whether the largest possible transcript was copied into every system.
Connect failures to ownership. Unaccepted cases need routing or staffing attention. Accepted but stale cases need a queue review or dependency decision. Incorrectly completed cases need quality investigation. These are different remedies; a single escalation percentage cannot tell the manager which one to apply.
The answer, clarify or handoff framework helps decide which route is appropriate during a conversation. The measurement task here starts after that decision: verify whether the route actually delivered the promised help. Correct routing logic and reliable follow-through are separate requirements.
7. Audit unknown outcomes without inventing certainty
The 270 silent exits without a repeat are the largest ambiguous group in Alder’s AI cohort. Ignoring them wastes information. Calling all of them successful invents certainty. Calling all of them failures makes the system look worse than the evidence supports. A structured audit is a better next step.
Draw a random sample from the eligible group and preserve how it was selected. For illustration, suppose Alder reviews 60 of the 270 episodes. Reviewers find 36 with adequate answers and task evidence, 12 with inadequate answers and 12 that remain unjudgeable. These are constructed audit results, not additional verified outcomes already included in the earlier 610 total.
The sample’s adequate-evidence rate is 60%. That is a sample estimate, not a license to mark 60% of every silent customer as resolved in the operational ledger. The sample has uncertainty, the judgment process may have error, and adequate answer evidence is not always proof of a customer’s downstream completion. Report the estimate alongside its scope and limitations.
Do not replace the original records with inferred labels. Keep individually reviewed outcomes separate from estimated population results. If a management report uses an extrapolation, label it as modeled and retain the observed measure next to it. That separation lets the business improve its measurement without rewriting uncertainty as fact.
Stratify when the group contains materially different tasks. Sample order changes, policy questions and product advice separately if their evidence standards differ. If you intentionally oversample rare consequential tasks, weight any population estimate appropriately. A collection selected because it looks problematic is excellent for finding defects but unsuitable for estimating the overall failure rate.
Use two reviewers on an initial overlap sample to calibrate the judgment rules. When they disagree, inspect the contract rather than averaging their opinions into a score. One may consider an accurate policy quote sufficient while the other expects an actionable next step. That disagreement identifies a definition the team needs to settle.
Record whether the reviewer could see the assistant version or prior label. Where practical, hide information that might bias the judgment. Keep the source material and operation result available, because those are necessary evidence. The aim is not to make review blind at any cost; it is to reduce avoidable influence without removing the facts needed to decide.
Use the audit to select fixes. If inadequate silent exits mostly lack a clear next step, revise the relevant answer contract and interface. If reviewers cannot judge because operation results are missing, improve the integration logs. If unknowns are concentrated in anonymous channels, state that coverage gap and consider a less intrusive confirmation mechanism.
8. Compare like work before declaring improvement
A rising resolution rate can come from an easier workload. During a promotion, support may receive many simple discount questions. During a delivery disruption, it may receive difficult exceptions. Comparing the blended percentages without the task mix can reward the system for a change it did not cause.
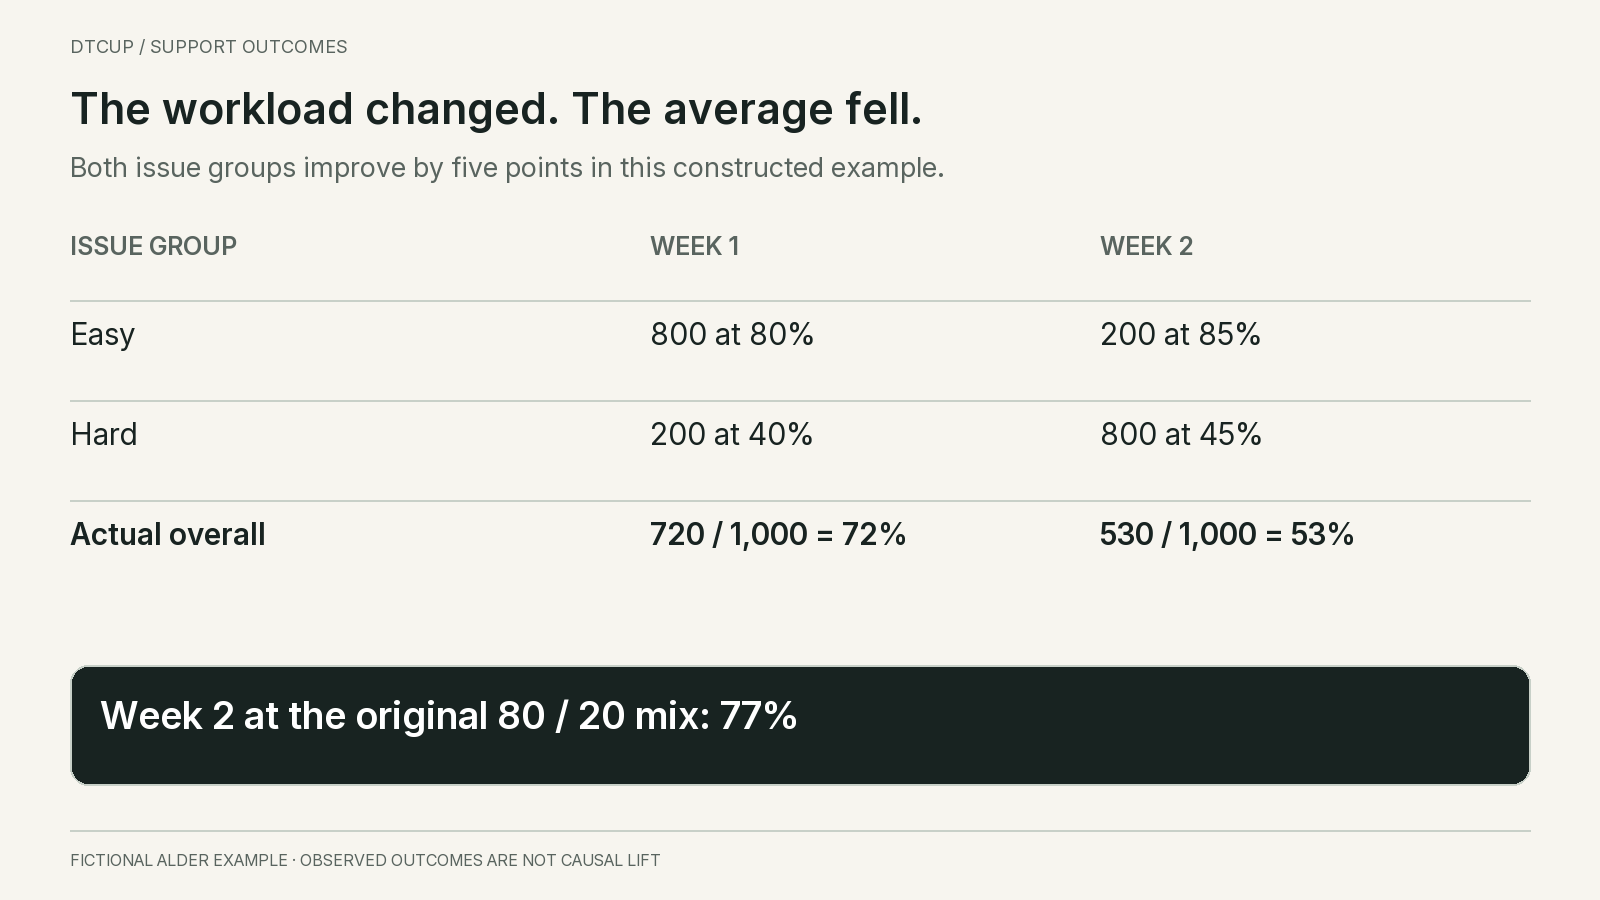
Consider a separate fictional comparison. In week one, 800 easy issues have an 80% evidenced-resolution rate and 200 hard issues have a 40% rate. That produces 720 resolutions out of 1,000, or 72%. In week two, there are 200 easy issues at 85% and 800 hard issues at 45%, producing 530 resolutions, or 53%.
The overall rate fell nineteen percentage points even though each issue group improved by five points. The workload moved toward harder cases. At the original 80% easy and 20% hard mix, week two’s standardized rate would be 77%. That calculation is a mix-adjusted comparison, not proof that the system caused the improvement.
Keep both views. The actual 53% describes the workload customers experienced in week two. The standardized 77% helps compare performance at a common composition. Hiding either view would mislead a different decision: staffing needs the actual volume, while a quality comparison needs to understand the mix.
Use a small number of meaningful segments first: issue family, risk, customer authentication state, language and channel where relevant. Too many overlapping slices create unstable rates and invite cherry-picking. Show counts next to percentages. A jump from one success out of two cases to two out of two is not the same evidence as a comparable change across thousands.
Match observation maturity as well. This week’s still-open cases should not be compared with last month’s fully followed-up cases without a clear age adjustment. Publish a provisional snapshot and a mature snapshot if the operation needs fast signals. The provisional report can guide incident response while the mature report supports outcome judgment.
Annotate policy changes, staffing outages, product launches and carrier incidents. These do not excuse failures automatically. They explain conditions that may require a different response. A model replacement should not receive credit for an improved delivery operation, and a support team should not be blamed for a denominator that suddenly includes a new channel.
For a causal claim, use a credible comparison design appropriate to the business, such as a controlled rollout with comparable eligible issues. Keep the same outcome definitions across groups and account for customers crossing between them. The weekly ledger can describe what happened; it cannot by itself establish what would have happened without the assistant.
9. Count work that moves elsewhere in the operation
Avoided handoffs can reduce agent workload, but only when the avoided work is real. In Alder’s main cohort, 160 initial escalations and 114 later repeats mean that 274 AI-engaged episodes eventually involve a person. Add the 200 human-only episodes and 474 of the original 1,000 issues receive human attention during the observation window.
The other 526 AI-engaged episodes have no observed human involvement: 216 evidenced autonomous resolutions, 270 silent unknowns and 40 abandoned episodes. A “no human involvement” rate of 526 divided by 800, or 65.75%, is therefore not equivalent to a 65.75% successful automation rate. Its composition matters.
Measure the actual work rather than multiplying avoided tickets by a convenient average. A handoff from AI may arrive with excellent context and take less time. It may also arrive after a wrong promise that makes the conversation longer. A change in the number of contacts can be offset by a change in the difficulty of the remaining work.
For a simple workload illustration, assume the 474 human-touched episodes average twelve active minutes each. That is 5,688 minutes. Add 400 minutes of monitoring, 300 minutes of quality review and 200 minutes of integration maintenance during the same period. The measured total is 6,588 minutes under those assumptions. It is not a savings estimate because no credible alternative-workload comparison has been supplied.
Separate active handling time from elapsed waiting time. A customer may wait two days while an agent spends only ten minutes working. Reducing the agent’s minutes does not necessarily improve the customer’s wait. Conversely, faster routing can reduce waiting without materially reducing labor. Both can be valuable, but they should be described accurately.
Include exception cleanup. Someone may have to reverse a duplicate action, correct a promised delivery date or update a policy entry that produced several wrong answers. That work belongs to the operating picture even if it occurs outside the support platform. Do not ask teams to fill out an elaborate timesheet for every trivial task; use a proportionate sampling method and label estimates.
Look for structural reductions in demand. If many customers ask where to find a return label, improving the order page may remove the need to ask at all. That is different from deflecting an existing question into chat. The best support investment may be a clearer product or fulfillment experience rather than a more persuasive assistant.
A workload scorecard should therefore include demand volume, evidenced outcomes, customer waiting and operating effort. A single ticket count cannot reveal whether the business removed a problem, handled it efficiently or merely made it harder to reach a person.
10. Build a scorecard that produces a decision
Keep the first version compact. Put the cohort definition at the top: eligible issue episodes opened during the specified period, the channels covered, the observation window and the date on which the cohort becomes mature. Add the assistant configuration and any important operational changes. A reader should not have to guess which population a percentage describes.
Lead with evidenced resolution across the whole support system, split into autonomous, AI-assisted human and human-only outcomes. Show pending and unknown shares beside it. This makes the business accountable for the customer journey rather than encouraging the AI team and human team to optimize separate scoreboards.
Then show verified same-issue repeats from apparent closures, with counts and timing. Add completed handoffs and the age of unresolved work. Include a small quality panel for consequential failures. A severe unauthorized action should not disappear inside an otherwise improving average, even if the event is too rare to produce a stable percentage.
Use a workload panel for actual human effort and the maintenance needed to keep the assistant useful. Keep modeled savings in a separate section with assumptions and a comparison design. This prevents an optimistic labor estimate from being repeated as an observed financial result.
For every highlighted change, attach one or two representative episodes. Numbers establish scale; examples establish mechanism. A repeated order-change failure with a missing tool confirmation suggests a different repair from a policy answer that is accurate but impossible to understand. The examples should be de-identified and accessible only to appropriate reviewers.
End with a short action record: problem, evidence, proposed change, responsible owner and the next review condition. For example, “Twenty reviewed return questions lacked the location of the label; add the verified link and test whether the same-issue repeat pattern declines.” That is a specific intervention. “Improve chatbot quality” is not.
Connect the production finding to a regression case in the AI support evaluation set. The production scorecard discovers recurring failures under real conditions. The test set helps prevent known failures from returning during later changes. They support each other but have different denominators and should not be blended into one accuracy percentage.
When evidence is thin, write “insufficient information” and specify what would resolve the uncertainty. That might be a better link between channels, a completed observation window or a review sample. An honest unknown with a clear next step is more useful than a confident number that no one can reproduce.
11. Implement the ledger without rebuilding the support stack
A small operation can begin with exports and a reviewed worksheet. Use stable episode identifiers, retain source conversation links and record the evidence rules in a separate definition sheet. Start with one or two issue families where repeat contact is costly and the task outcome is observable. A limited trustworthy view is better than an elaborate report whose joins are unexplained.
Check the accounting before drawing conclusions. Every eligible episode should appear once in the cohort total. First-exit categories should be mutually exclusive. Final outcome categories should reconcile to the same population. Human involvement can overlap with AI involvement, so those counts must not be added as if they represent different customers.
Validate a handful of records from beginning to end. Open the original conversation, inspect the order or operation evidence if authorized, find any follow-up and reproduce the final classification. If an analyst cannot do that, the chart is not ready to support a confident claim. Fix the source relationship before adding more visualization.
Automate only after the definitions are stable enough to implement. Preserve timestamps, category revisions and reviewer notes. Keep access restricted because support records may contain personal information. The operational dashboard usually needs counts and de-identified examples, not broad access to raw conversations.
Choose an owner for definition changes. If the business changes what counts as a repeat, an eligible issue or an evidenced resolution, version the rule and annotate the report. Recompute historical comparisons only when the source data supports it, and make the restatement visible. A metric that changes meaning silently will eventually stop being trusted.
The first successful review does not need to show a dramatic improvement. It should expose one meaningful gap between apparent closure and customer outcome, identify the mechanism, and create a repair the team can verify. Repeating that process is how measurement becomes an operating habit rather than another dashboard project.
12. Questions that often change the interpretation
Is ticket deflection useless?
No. It describes routing and can help estimate capacity needs when its definition is clear. It becomes misleading when it is presented as proof that customers received correct help. Keep it beside outcome quality, repeat contact and unknown cases. The combination tells a much more useful story than either deflection or satisfaction alone.
Do we need feedback from every customer?
No. Some tasks have strong operational evidence, such as a permitted change confirmed in the source system and accurately explained to the customer. Other tasks remain uncertain without follow-up. Use the least burdensome evidence that fits the job, audit what cannot be observed directly, and do not turn missing feedback into a fabricated outcome.
Should every repeat contact count as an AI failure?
No. Preserve planned continuation, new information and external delays as distinct reasons. A repeat is a signal to inspect the journey. It becomes evidence of an AI failure when review shows that the assistant’s answer or action caused unnecessary additional work, violated the task contract or falsely implied that the issue was complete.
What if the support volume is small?
Review more individual episodes and make fewer claims from percentages. Keep the same definitions so evidence accumulates over time, but do not combine unrelated policies or versions just to create a larger sample. A small number of repeated, clearly understood defects can justify a practical fix even when it cannot establish a precise population failure rate.
What should the primary goal be?
I would make the goal a reliably completed customer task with proportionate effort. Measure whether the answer or action was adequate, whether unfinished work reached an owner and whether the customer had to start again. Automation deserves credit when it improves that complete journey. A conversation disappearing from a queue is only the beginning of the evidence.
Sources
Still have a question?Ask the DTCUP Community ↗