
DTCUP Intelligence: Connect Orders, Channels and Customer Journeys to Better Questions
Ask better reporting questions with DTCUP Intelligence. Reconcile money definitions, inspect source evidence and separate attribution credit from observed behavior and missing history.

7 years of experience building and operating brand websites, specializing in website development, paid advertising and SEO. Built a brand website from launch to US$10 million in annual sales.
The Short Answer
DTCUP Intelligence connects reporting questions with available order, channel and journey evidence. Begin by aligning the source, dates, money definition and attribution model. Drill into original source details, distinguish observed activity from qualifying touches, and keep historical coverage visible. Attribution credit supports analysis; it does not prove that a channel caused the sale.
Key takeaways
- Confirm definitions before comparing totals.
- Channel identity and paid or organic medium are different dimensions.
- Missing history and shared journeys limit what a report can establish.
There is a particular kind of meeting in which everyone brings a revenue number and nobody brings the same one. The advertising platform has a confident number. The commerce platform has a different confident number. Analytics arrives with a third number and a slightly different definition of confidence. Someone suggests averaging them, which is an understandable emotional response and an unfortunate analytical method.
The better starting point is to ask what each number represents. Which orders are included? Which date boundary applies? Does revenue include tax or shipping? Which attribution model assigns credit? What source history is actually available? These questions are less theatrical than declaring a winner, but they are much more likely to improve the next business decision.
DTCUP Intelligence brings connected business evidence into a workspace where you can inspect those distinctions. Its order and channel views are useful because they can lead to source details and retained journey evidence, rather than asking you to accept a total without context. The aim is a more informed question and a traceable next step, not a dashboard that makes every uncertainty disappear through excellent typography.
This guide uses an illustrative home-accessories business reviewing a collection launch. All numerical examples are fictional teaching examples, not customer performance claims. Available views depend on the workspace’s permissions, connected sources, and data coverage. The guide focuses on verified order, source, attribution, and review workflows rather than treating every possible integration or future feature as already available to every account.
Begin with one business question
Our example business wants to understand which channels participated in orders during a collection launch and where the evidence is incomplete. That is a workable question. “Tell us everything about growth” is a generous invitation to create a very large screen and a very small conclusion.
Write the question before choosing columns. It determines which dates, sources, definitions, and details matter. If you are examining the order total, begin with eligible orders and the money definition. If you are examining a particular channel’s role, inspect the attribution model and the qualifying touches. If you are examining website traffic, remember that a visit is not automatically an order-credit event.
Add the decision that might follow. The team may need to repair campaign naming, improve a landing page, investigate missing source data, or request a more controlled test. A report is more useful when you know what kind of action its evidence could support. Otherwise, it can become a beautifully organized place to postpone choosing.
Keep the first investigation narrow enough to finish. Choose a launch period and the relevant store or website. Note any unusual promotion, stock issue, or site change that could affect interpretation. These notes do not need to become an elaborate journal. They simply prevent the numbers from floating away from the business conditions that produced them.
The result you want is a sentence that connects an observation to a next step. For example: “The channel grouping is consistent, but several orders lack qualifying journey evidence, so we should review coverage before changing the budget.” That sentence may be less exciting than a dramatic channel ranking. It is also less likely to send the team confidently in the wrong direction.
Confirm the workspace and source before reading the total
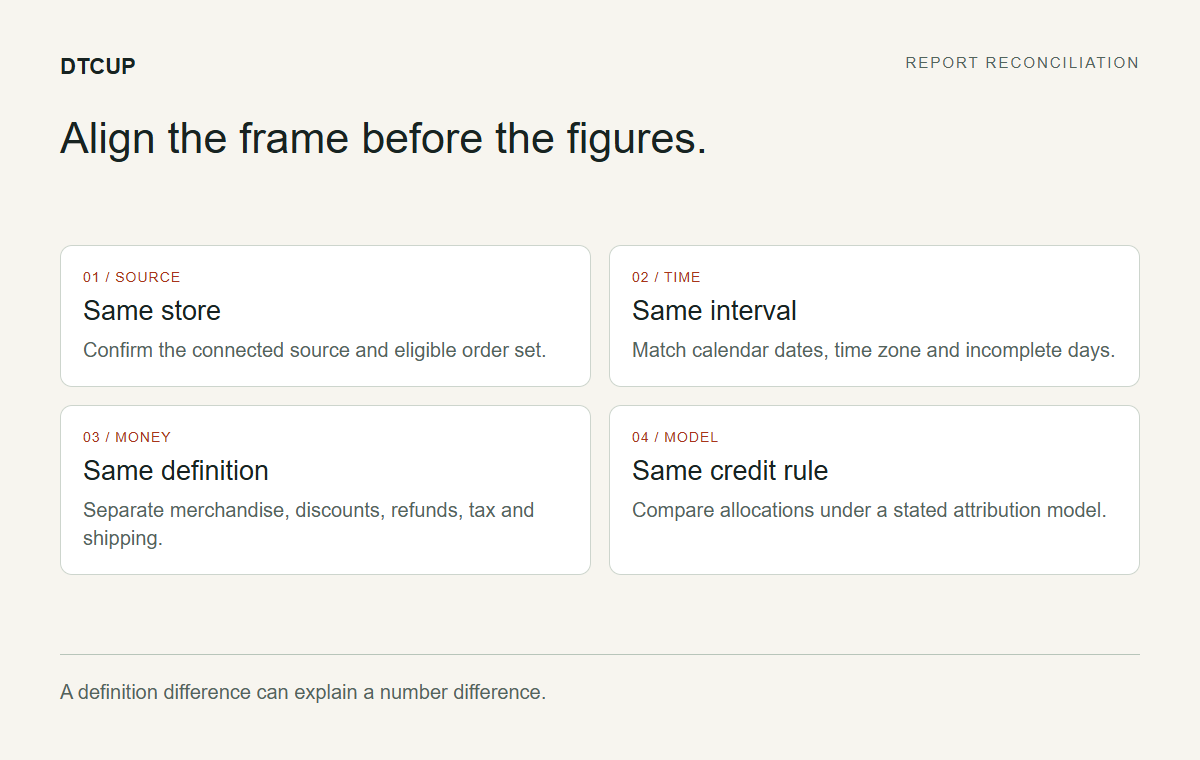
Start by confirming that you are in the intended workspace and looking at the intended connected source. A familiar brand name in the corner is helpful, but it does not replace checking the selected store or website. Teams that manage several properties can otherwise spend an impressive amount of time explaining the wrong account.
Review source availability and connection status. A view can only report what the authorized connections and retained evidence supply. An unconnected advertising account does not become connected because a channel name appears in a website journey. A recorded referral can identify a source without supplying that platform’s campaign spend, impressions, or ad-group metadata.
Distinguish provider reports from DTCUP’s website and order evidence. A provider may report conversions under its own rules, while DTCUP assigns website order credit under the selected model. Keeping those facts separate allows comparison without pretending they are interchangeable measurements. The difference is not automatically an error; it is a reason to inspect definitions.
For our home-accessories business, the initial check might confirm the commerce connection, the website tracking start, and which advertising sources are available for the period. If one source is missing, name the gap. Do not substitute zero for unavailable spend or assume the absent connection means no activity occurred.
This is a practical strength of a source-aware workspace: it gives the team places to investigate the basis of a result. The benefit depends on using those details. A transparent system can still be misunderstood if everyone skips the context and takes a screenshot of the biggest number.
Make dates and time zones part of the question
Choose the date range deliberately and read the displayed time-zone context. “Yesterday” is not the same set of hours for every person or platform. A late-night order can belong to different calendar dates under different time zones, which is enough to create a disagreement even when both systems contain the same transaction.
DTCUP’s shared date controls provide presets, custom ranges, and adjacent comparison choices. Apply the intended range, then verify the displayed interval. Comparison controls can help you examine a prior period or another relevant range, but the comparison is only useful when the available data and business context support it.
For the collection launch, the team might compare the launch week with the previous week. Before interpreting a percentage, ask whether both periods have comparable source coverage and whether the launch week includes a promotion or an incomplete current day. A visible increase can be real while the proposed explanation remains uncertain.
The Campaign Time Zone Planner is useful when coordinating the activity that produces these dates. Use it to clarify a shared launch instant or local-market schedule before the campaign begins. Then use the reporting time zone consistently during review. Planning time and reporting time should be related deliberately, not introduced to each other halfway through the analysis.
When comparing with another platform, align the actual calendar interval and time zone rather than matching only the label on the button. “Last seven days” may include different boundaries or a partial current day. Write the exact interval in the reconciliation note. This small habit can resolve a surprisingly large argument before anyone has to accuse the database of having opinions.
Define the money before comparing the money
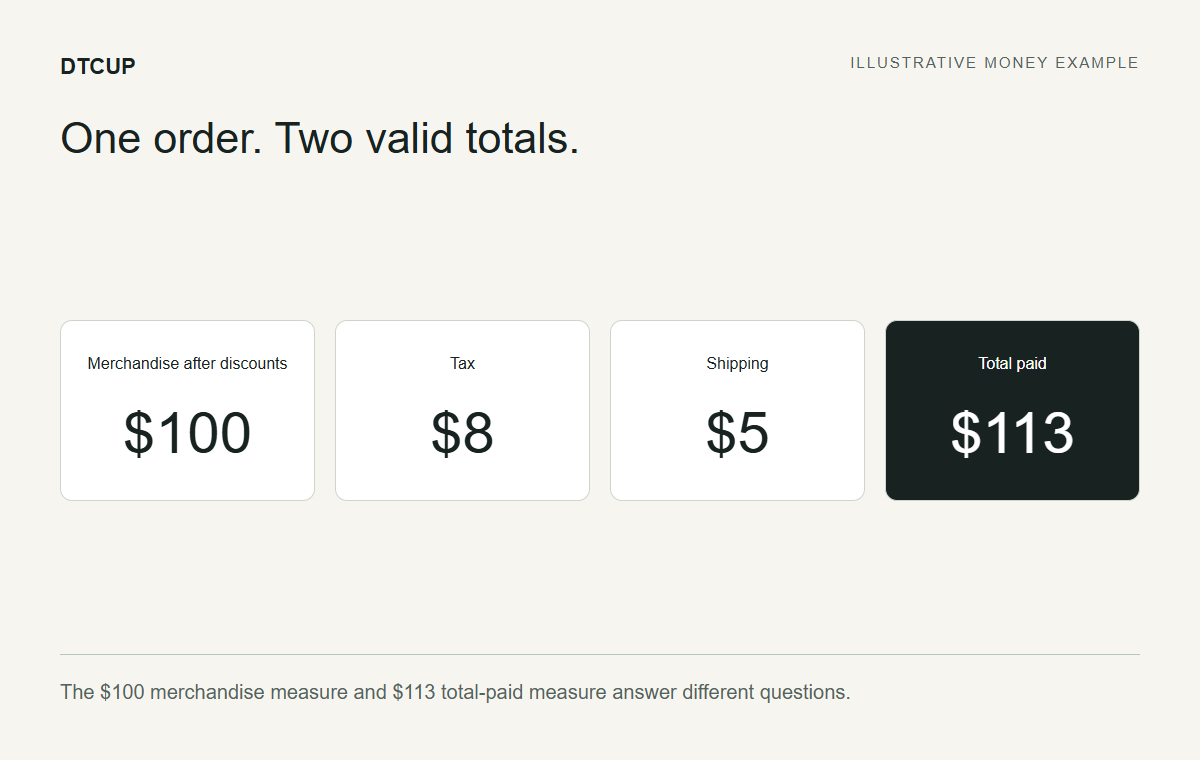
Revenue labels deserve careful reading. Merchandise value, tax, shipping, discounts, refunds, and gross or net measures can produce different totals from the same orders. A comparison is meaningful only when the definitions line up. The word revenue is not precise enough to do that work alone.
In DTCUP’s attribution context, the displayed net measure is based on merchandise after discounts and refunds, excluding tax and shipping. Read the current report explanation and reconciliation details for the exact view you are using. If another system includes additional components, the totals can differ without either system having lost an order.
Consider an illustrative order with one hundred dollars of merchandise after discounts, eight dollars of tax, and five dollars of shipping. A merchandise measure and a total-paid measure answer different questions. Adding them to one comparison table without labeling the components creates a discrepancy by design. The arithmetic is innocent; the headings need attention.
Check eligibility as well. Test, cancelled, or otherwise ineligible orders may be excluded according to the report’s rules. If you compare with a source-system list, confirm that the list applies the same conditions. A count mismatch deserves an order-level explanation before it becomes a theory about tracking quality.
For our example business, the first reconciliation task is therefore modest: align the period, eligible order set, currency context, and money components. Only then compare channel allocation. Trying to debug attribution while the two reports disagree on what counts as revenue is like tuning a radio while someone keeps changing the station.
Separate channel identity from traffic type
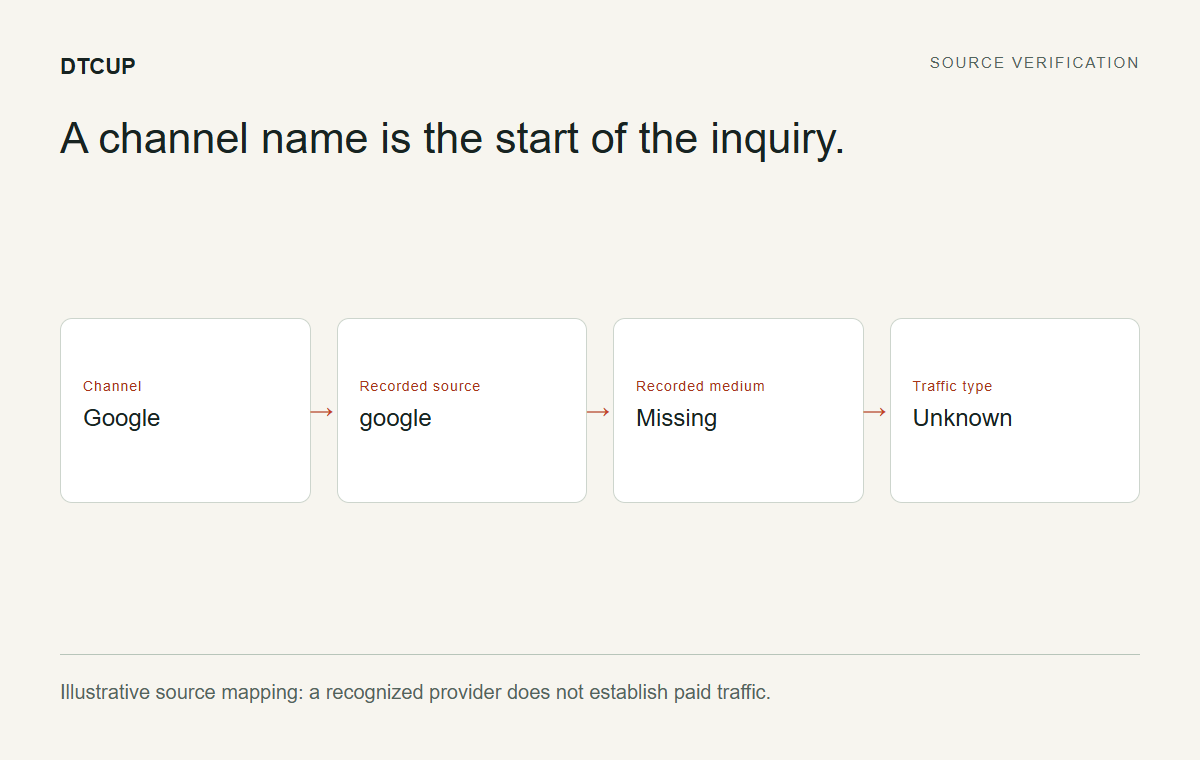
The top-level channel view groups recognizable providers and channels using the shared dictionary. Google, Meta, Microsoft, and other recognizable sources can appear as channel identities, while paid, organic, or an unknown traffic type belongs in the supporting medium and source evidence. This avoids turning one provider into several confusing top-level labels solely because the recorded medium differs.
That presentation does not invent a paid classification when the evidence is missing. A recognizable Google source with an unknown medium remains a recognizable provider with incomplete traffic-type detail. The correct response is to inspect the source evidence, not to assume every visit from that provider was an advertisement.
The shared dictionary is used across relevant pages, which helps keep the same source from acquiring a different display identity every time you navigate. The original recorded source and medium remain important. A unified label makes the interface easier to read; the source disclosure lets you verify how the label was reached.
For the home-accessories business, this distinction is useful when a channel total looks larger than the paid platform’s order count. The top-level provider may include several kinds of recorded traffic. Drill into the details before drawing a conclusion about the advertising campaign. Provider identity and paid performance are related questions, not identical ones.
Clear campaign inputs help this workflow. The UTM, QR & Campaign Link Builder can prepare consistent source, medium, and campaign labels for invitations you control. It cannot repair every missing historical label, but it can reduce avoidable ambiguity in future activity. Good analysis often begins before the first click, with a person naming a link sensibly.
Understand Other and Unattributed without mixing them
Other and Unattributed serve different purposes. Other can hold source evidence that does not resolve to a more specific recognized channel. Unattributed represents orders without qualifying credited journey evidence under the report conditions. Combining the two would make the table shorter while making the explanation worse.
An order can be commercially real even when its acquisition path is incomplete. Unattributed does not mean the customer materialized from a cloud of spreadsheet dust. It means the available evidence does not justify assigning qualifying channel credit in that view. Treat the label as a data boundary, not a customer behavior category you can confidently describe.
Likewise, Other does not mean worthless traffic. It means the current classification does not identify a more specific channel from the retained source evidence. Open the details, look at the recorded source and medium, and decide whether a recognizable source needs review or whether the evidence genuinely remains limited.
For our example launch, a large Unattributed amount should prompt questions about tracking start, consented browser evidence, identity linkage, and available historical source information. It should not prompt an automatic redistribution across the channels that happen to have data. That would make the totals look more complete by inventing an answer.
A useful review note distinguishes the two cases: “These orders lack qualifying touches” versus “These touches have source evidence that remains grouped as Other.” The first concerns credit availability. The second concerns source identification. Keeping them separate helps the team choose the right investigation and avoids treating all uncertainty as one giant miscellaneous drawer.
Choose an attribution model for the question you are asking
An attribution model is a rule for assigning credit among qualifying touches. Changing the model can change channel allocation without changing the underlying order total. That is expected. The model is a lens applied to the available evidence, not a time machine that reveals every influence on the customer.
DTCUP provides implemented model choices with explanations beside the selector and links to the attribution model guide. Read the explanation before choosing. A first-touch question differs from a last-touch question, and a shared-credit model answers a different question again. The best choice depends on what you are trying to understand.
Imagine an illustrative customer first arrives through a public guide, later follows an email, and finally returns directly before buying. Different qualifying-touch rules and models can distribute credit differently across that retained sequence. The disagreement is not necessarily a calculation defect. It reflects the rule you selected and the evidence that qualifies under it.
Do not search for the model that makes your favorite channel look best. Choose a model that fits the investigation, then consider whether another lens reveals a useful contrast. The purpose is to learn about recorded roles in a journey, not to audition several methods until one produces a flattering chart.
Keep the model fixed when comparing periods unless the comparison is explicitly about model sensitivity. If you change the dates, source filters, and model together, the resulting movement becomes difficult to explain. One deliberate change at a time makes the report easier to interpret and the conversation considerably less theatrical.
Read order counts and fractional credit as different measures
A channel can participate in a journey without receiving all of the order’s credit. An order can also contain several qualifying channels. This means participating-order counts, credited-order counts, and fractional purchase measures do not necessarily behave like interchangeable totals. Read the column definitions before adding numbers together.
First, last, and assisted counts describe roles in qualifying sequences and can overlap. A customer’s order may contribute to more than one channel’s observed participation. Summing those counts across rows can therefore exceed the distinct number of orders. That is not automatically double-counting in the underlying order ledger; it may be the intended meaning of the participation measure.
Fractional credit is another distinction. Under a shared-credit model, one order can distribute fractions across touches or channels according to the implemented rule. The fractions help express allocation, but they do not mean a customer placed half an order. The customer probably remembers buying the whole lamp, even if the report distributes its credit politely.
For our home-accessories business, choose a small illustrative journey and explain the columns against it before presenting a large table to colleagues. Ask which columns are distinct-order measures, which are roles, and which are model allocations. This short exercise can prevent a misleading total from reaching a budget meeting.
When a count looks surprising, inspect the relevant order list or source detail instead of assuming every clickable number refers to the same set. DTCUP keeps participating-journey navigation distinct from credited-order meanings where those sets differ. Follow the label and explanation rather than treating all blue numbers as identical doors.
Drill from a channel into the evidence behind it
Click a channel to inspect its source and campaign details under the selected report conditions. Look for the recorded source, medium, and campaign values that explain the top-level grouping. This is where an apparently simple channel name becomes a set of actual evidence combinations you can review.
The source disclosure helps distinguish the original classification from the canonical display identity. A normalized channel can be useful without rewriting the raw facts. If a missing medium is shown as unknown for display, do not treat that as a recorded campaign value. The difference matters when you are diagnosing naming or tracking gaps.
Where supported connected ad-platform data is available, the drilldown can also expose campaign and ad-group or ad-set detail, with further ad metrics. Keep that provider reporting separate from the website’s model-based order credits. Selecting a website attribution model does not magically recalculate the provider’s own reported conversion logic.
Some details may be unavailable or represented by identifiers rather than friendly names. That is a source limitation to acknowledge, not a reason to invent a more polished label. A missing field can still leave useful spend or campaign evidence, provided the report makes the boundary clear and the reader respects it.
For our example team, a practical question is: “Which recorded campaigns sit inside this channel total, and which provider metrics are actually available for the same period?” That question leads to a concrete comparison. “Why does this not look exactly like another platform?” is too broad until the definitions and source coverage have been aligned.
Use custom categories to reflect a real business question
Default channels are useful for provider-level review, but a team may also want to group activity by its own business logic. DTCUP’s custom categories support configured rules across channel, source, medium, and campaign, with ordered matching and explicit fallback behavior. This lets a workspace organize evidence around a meaningful internal distinction.
For the home-accessories launch, the team might distinguish a collection campaign from ongoing activity using an approved campaign naming pattern. The rule should be based on the recorded fields that actually support that distinction. Do not label a category “new customer acquisition” merely because the name sounds strategic if the rule only checks a vague word in a campaign title.
Review rule order and matching conditions carefully. A broad condition placed before a narrow one can affect which category receives a matching row. Use representative examples and confirm that the configured categories mean what their labels imply. Configuration is business logic expressed through controls; it deserves the same care as the sentence describing the analysis.
Keep an unassigned fallback visible for evidence that does not match your rules. A category system should reveal gaps rather than force every row into a misleading bucket. Unattributed orders also remain distinct from category assignments based on source evidence. Custom organization does not create missing journeys.
Document the purpose of a category before using it in recurring decisions. A colleague should be able to understand why the rule exists and what it includes. The benefit is a reporting view closer to the business question, not an excuse to rename uncertain evidence until it resembles a finished strategy.
Inspect an order journey without turning every event into attribution
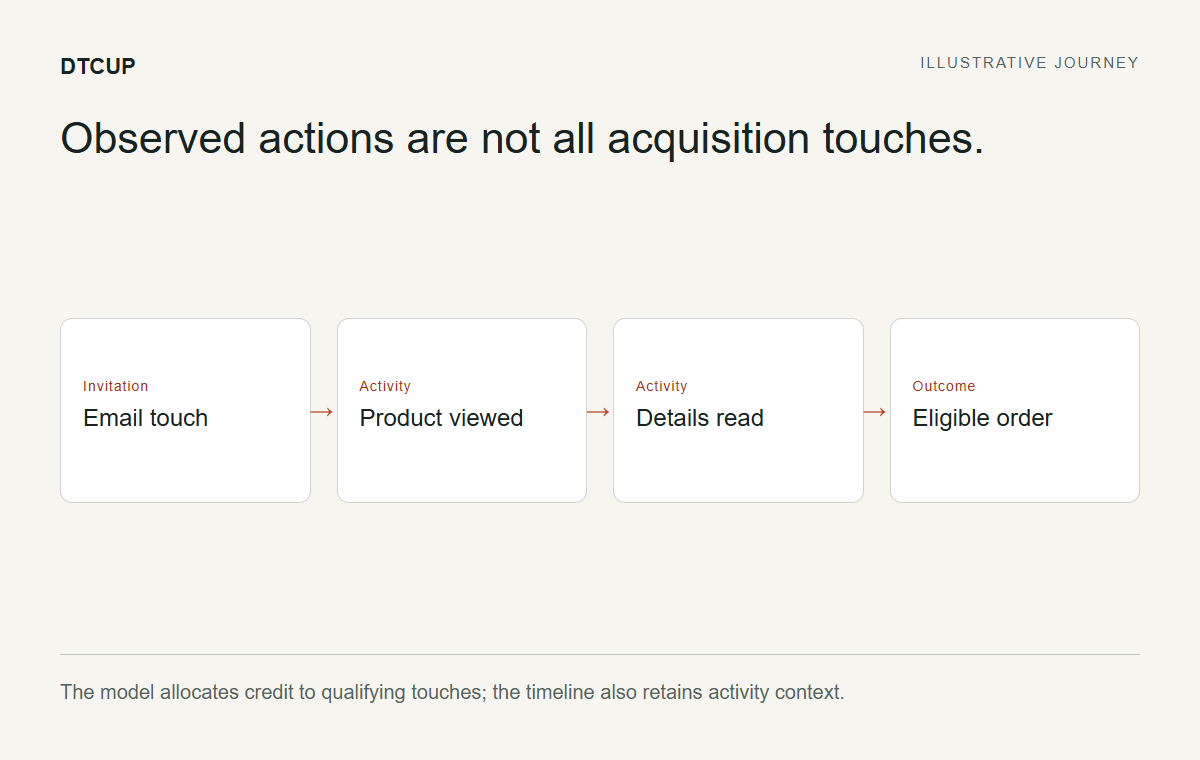
The order journey view lets you inspect retained evidence associated with an order. Page views, product views, cart actions, and qualifying acquisition touches can tell different parts of the story. An observed action is not automatically an acquisition touch, and a timeline entry is not automatically entitled to conversion credit.
For example, a product view can show that a linked visitor examined an item. It does not necessarily identify a new channel invitation at that moment. If the report labels the event as an observed action rather than an acquisition touch, preserve that distinction in your explanation. The timeline is richer than the attribution calculation, which is exactly why it is useful.
Page context may be available through safe retained paths or product information. Sensitive paths can remain hidden, and information that was not retained cannot be reconstructed by a more enthusiastic label. When a timeline entry lacks a readable page name, investigate the actual available evidence rather than inventing what the person must have visited.
The compact channel icons on order cards help you scan participation, with additional channels represented by an overflow count. Open the order when you need the full context. Icons are an overview, not a replacement for reading timestamps, event roles, and qualifying evidence.
For our example business, a useful journey review might reveal that a customer read a size guide before buying. That can suggest a content question, but it does not establish that the guide caused the purchase. Use the observation to improve the next investigation: perhaps the guide deserves clearer placement, or perhaps you should test whether easier access helps visitors complete their task.
Treat historical coverage as a boundary, not an inconvenience
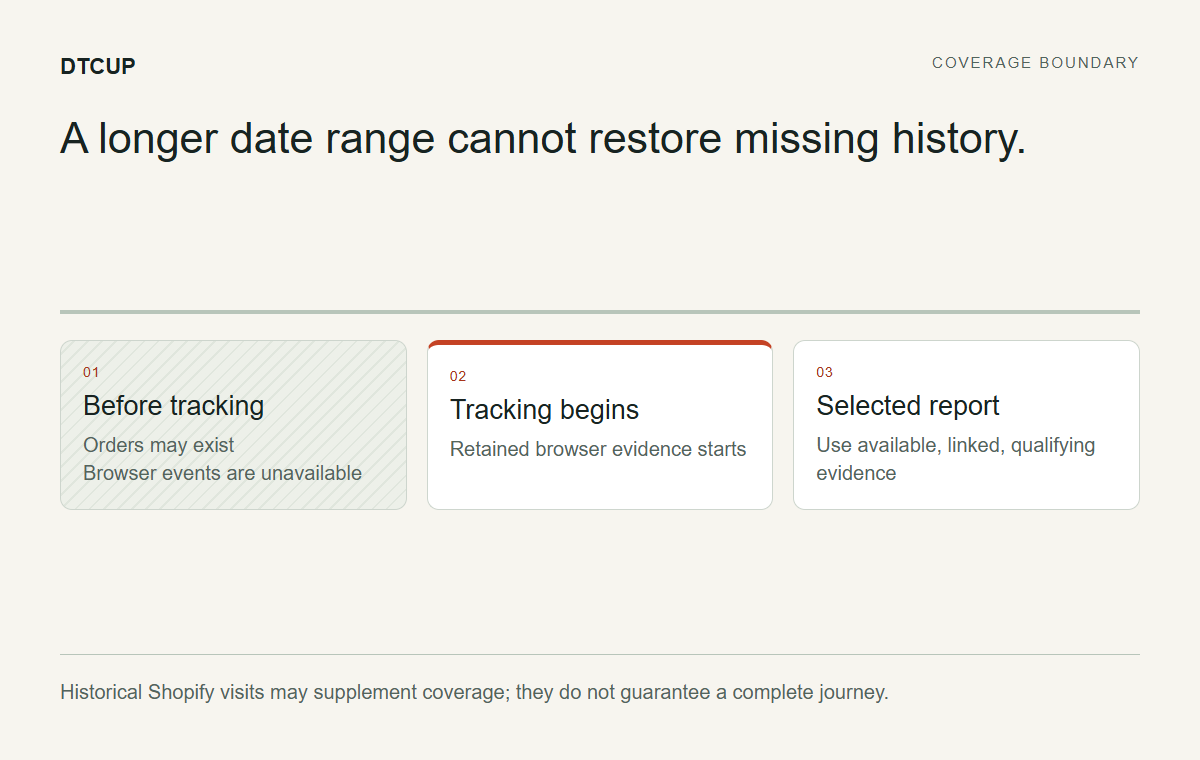
If tracking began recently, the workspace cannot observe browser events from before that installation simply by selecting a longer reporting period. Historical order data and historical browser journeys are different things. A complete order list can coexist with incomplete acquisition evidence.
Where available and authorized, Shopify historical customer-journey information can supplement DTCUP’s native retained tracking. That can add useful order-bound visits, but it does not guarantee a complete reconstruction of every earlier touch. Coverage depends on what the source provides and what can be safely retained and linked.
For the launch review, read the earliest available history and any coverage message. If the selected period begins before reliable journey evidence, interpret channel allocation accordingly. Do not treat the unobserved part of the period as if customers had no marketing interactions. Absence of retained evidence is not evidence that the customer lived outside the internet until checkout.
Likewise, a lookback rule determines which available touches can qualify; it does not restore missing ones. Changing the reporting window or model cannot manufacture an earlier first touch. This is one of the most important distinctions to explain when comparing a newer tracking installation with a platform that has a longer observation history.
The useful next action may be to improve future coverage, verify current tracking, or narrow the comparison to a period with better evidence. That is more defensible than redistributing missing history across known channels. An honest boundary makes the report more trustworthy, even when it makes the conclusion less tidy.
Read channel overlap as shared participation
Channel overlap helps show orders whose retained qualifying journeys include selected channels. It is useful for asking where channels appear together. It is not a measurement of incremental lift, and it does not establish that one channel caused another to work.
Suppose an illustrative overlap view shows orders involving both email and a search provider. The shared set tells you that both appear in those qualifying journeys under the current conditions. It does not tell you what would have happened if email had been removed. That counterfactual requires a different kind of evidence than observing two labels in the same path.
Inspect shared orders when the pattern matters. Look at the timing and roles of the retained touches, then ask whether the pattern suggests a useful customer question. Perhaps people search again after receiving an email because they need product details. Perhaps they return through familiar routes. Several explanations can fit the same observed overlap.
Use the view to improve coordination between channels rather than declaring that the larger circle deserves the entire budget. A useful response may be a clearer product page, more consistent message, or better campaign labeling. The overlap is a prompt for investigation, not an automatic allocation instruction.
For the home-accessories team, the practical output might be a small set of shared journeys to review with content and marketing colleagues. Keep the order-level evidence private and discuss the pattern at an appropriate level. The aim is to understand the experience, not to turn individual customers into public case studies without permission.
Turn journey questions into better pages
Once a pattern raises a plausible content question, use the toolkit to work on the page. If visitors seem to need clearer dimensions, assembly information, or product comparisons, first verify those facts with the source material. Then decide where the information belongs in the page’s reading order.
The Query Fan-Out Explorer can help broaden the question set, while customer support and real product evidence help determine which questions matter. Treat suggested topics as candidates, not proof of demand. A useful content plan combines exploratory ideas with observed business needs.
Use Sketch to Website to draw the revised arrangement and communicate the purpose of each section. You might place dimensions beside the product imagery or bring a delivery explanation closer to the action. The drawing makes the proposed change concrete enough to review before implementation.
If a supported 3D model is part of the product presentation, inspect it in the Online 3D Viewer. Check whether the orientation and materials help explain the real product, and note any asset limitations. A journey observation does not authorize inventing a better-looking product than the one customers will receive.
For a smaller frontend idea, the HTML, CSS & JavaScript Editor can help prototype the interaction. Keep the implementation review focused on the visitor’s task: can they find, understand, and act on the information? The report identifies a question; the design work creates a testable response.
Check the changed page before measuring it again
After implementation, review the actual page rather than assuming the prototype survived intact. Check the content, mobile layout, keyboard interaction, and destination of the main action. A new information block that is hidden behind a broken accordion is technically present and practically absent.
The Website Page Checker can add selected SEO, speed, and detectable accessibility findings. Use those findings to identify issues for review, then perform the manual checks required by the experience. A clean automated result is not a guarantee that every customer journey works.
Where appropriate, update truthful structured data with the Website Schema Generator and validate the rendered output. Keep the markup consistent with the visible content and avoid duplicate or conflicting descriptions from multiple publishing sources. The purpose is accurate machine-readable context, not a promise of improved rankings.
If the publishing change affects public paths or discovery policy, inspect the relevant origin with the AI Bot & Robots Checker. Keep policy analysis separate from actual crawl access and search appearance. The page should be usable by visitors and governed by the publishing preferences you intend.
Then return to the original measurement question. Note what changed and when, keep the definitions consistent, and allow the available evidence to determine the next conclusion. If several major changes happened together, acknowledge that the report may not isolate their individual effects. A careful learning cycle is more valuable than a fast but unsupported success claim.
Use AI assistance with a defined question and known context
Where Ask DTCUP is configured and available to the workspace, use a specific question grounded in the evidence you have just reviewed. “What should we inspect next given incomplete journey coverage?” is more useful than “Which channel should we scale?” when the data cannot support a confident allocation decision.
Review the context and consent requirements before submitting a request. AI assistance is a separate action, not an automatic consequence of opening a report. A generated explanation should be evaluated against the source evidence and definitions, just as you would evaluate an analyst’s written interpretation.
Ask for alternative explanations when a pattern is ambiguous. A change in attributed revenue could reflect order volume, source coverage, the model, campaign timing, or several business factors. A useful response should help prioritize checks rather than turn the first plausible explanation into a fact.
Do not let fluent wording conceal missing information. If spend is unavailable, a confident return calculation is not improved by a polished paragraph. If history is incomplete, a first-touch story remains qualified. The role of assistance is to organize reasoning around the evidence, not to supply certainty as a substitute for it.
For our example team, the most useful output may be a short investigation plan with named data gaps and a next page-review task. That is a perfectly respectable result. Intelligence earns its name by helping people ask and answer better questions, not by making every answer sound like a triumphant board presentation.
Reconcile one disputed row before debating the whole dashboard
When a colleague challenges a channel total, choose one representative discrepancy and trace it methodically. Start with the exact report conditions, then identify the relevant order set or source grouping. A focused example makes it easier to distinguish a definition difference from a missing record or a classification problem. Trying to explain the entire dashboard at once usually produces a longer meeting rather than a better answer.
Suppose the colleague expects a particular order to appear under a paid channel. Confirm that the order is eligible in the selected period, then inspect the retained qualifying touches. Is the provider recognizable? Is the medium recorded? Which model is selected? Is an earlier touch outside the available history? Each answer narrows the issue without assuming that the expected channel must be correct.
If the discrepancy concerns money, return to the order components before inspecting the model. A refund or excluded shipping amount can explain a value difference without any change in source allocation. If it concerns a provider campaign, confirm that the external platform’s reporting basis matches the comparison being attempted. The shortest path to a useful explanation follows the type of discrepancy.
Write down the conclusion at the same level of precision as the evidence. “This order is present, and the difference is shipping included in the comparison total” is specific. “Everything reconciles” is much broader and requires much more evidence. Solving one example can teach the team how to investigate the rest without pretending the sample proves the whole account.
If the evidence remains insufficient, preserve that conclusion too. A missing historical visit may prevent a definitive channel assignment. A unavailable provider field may prevent a detailed comparison. These are valid outcomes of reconciliation, provided they are explicit. The purpose is to understand the result, not to force every disagreement into a resolved status.
Over time, this habit gives the team a vocabulary for recurring issues: date boundary, money definition, source identity, qualifying touch, coverage gap, and model allocation. That vocabulary makes future conversations faster because people can name the question instead of describing every discrepancy as “the numbers look wrong.” A useful workspace supports that learning; a useful team actually practices it.
If the same definition difference appears repeatedly, add it to the team’s review checklist. A short shared explanation can prevent several people from investigating the same non-error every month and leave more time for questions that genuinely require new evidence.
Build a review habit that ends in a decision
At the end of a review, write three things: the observation, the limitation, and the next action. The observation should refer to the actual selected data. The limitation should name what prevents a stronger conclusion. The action should be specific enough that someone can carry it out and verify completion.
For example: “Several retained journeys include the size guide before purchase; the sample does not establish causality; review the mobile placement and test a clearer route to the guide.” That is a useful chain of reasoning. “The size guide drives revenue” is shorter, but it skips the part where the evidence earns the claim.
Keep current-filter exploration lightweight. Changing dates or models should help you inspect results, not create an automatic pile of report copies. Preserve the underlying source evidence and deliberate business configuration while treating the current view as an investigation. If your team needs a specific approved decision document, create it intentionally and label its definitions and date.
The distinctive value of DTCUP Intelligence is the connection between summary, channel identity, source detail, model explanation, and retained order evidence. You can move from a broad question to the facts that support or limit an answer. It does not require pretending that provider dashboards agree, historical gaps disappear, or attribution proves causality.
Start with one question your team actually needs to answer. Align the dates and money, inspect the channel evidence, and choose the next useful action. You may still have three revenue numbers at the next meeting, but this time you can explain why they differ. That is a much better use of intelligence than averaging them and ordering a celebratory cake.
Sources
Still have a question?Ask the DTCUP Community ↗