
One Order, Several Channels: Count Participation Without Double-Counting Revenue
Six orders can appear in nine channel rows without creating extra sales. Follow a worked ledger through participation, fractional purchases, linear weighting and report filters.

7 years of experience building and operating brand websites, specializing in website development, paid advertising and SEO. Built a brand website from launch to US$10 million in annual sales.
The Short Answer
Count distinct transactions at order level, use participation to describe overlapping channel sets, and use explicit within-order weights for additive purchase and revenue credit. Keep unresolved orders and report settings visible.
Key takeaways
- Participating-order counts overlap across channels and are not additive.
- Fractional purchases are analytical shares, not partial checkouts.
- Equal-channel and equal-touch models can allocate the same order differently.
- Revenue and order-count denominators must have compatible meanings.
- Filters and category grouping can change the calculation if they rerun allocation.
- Reconcile source totals and inspect journey evidence; either check alone is insufficient.

The channel rows say search participated in three orders, email in four and social in two. There were only six orders in the store. Someone assumes the tracking is broken, while someone else adds the channel revenue and reports a sales total far above the money customers paid.
Both reactions can come from reading a valid participation report as though it were an additive revenue allocation. One order can involve several channels. Counting that order once in each participating channel is useful for understanding overlap, but those row counts cannot simply be added to recover the number of unique orders. Allocating a share of the order is a different calculation.
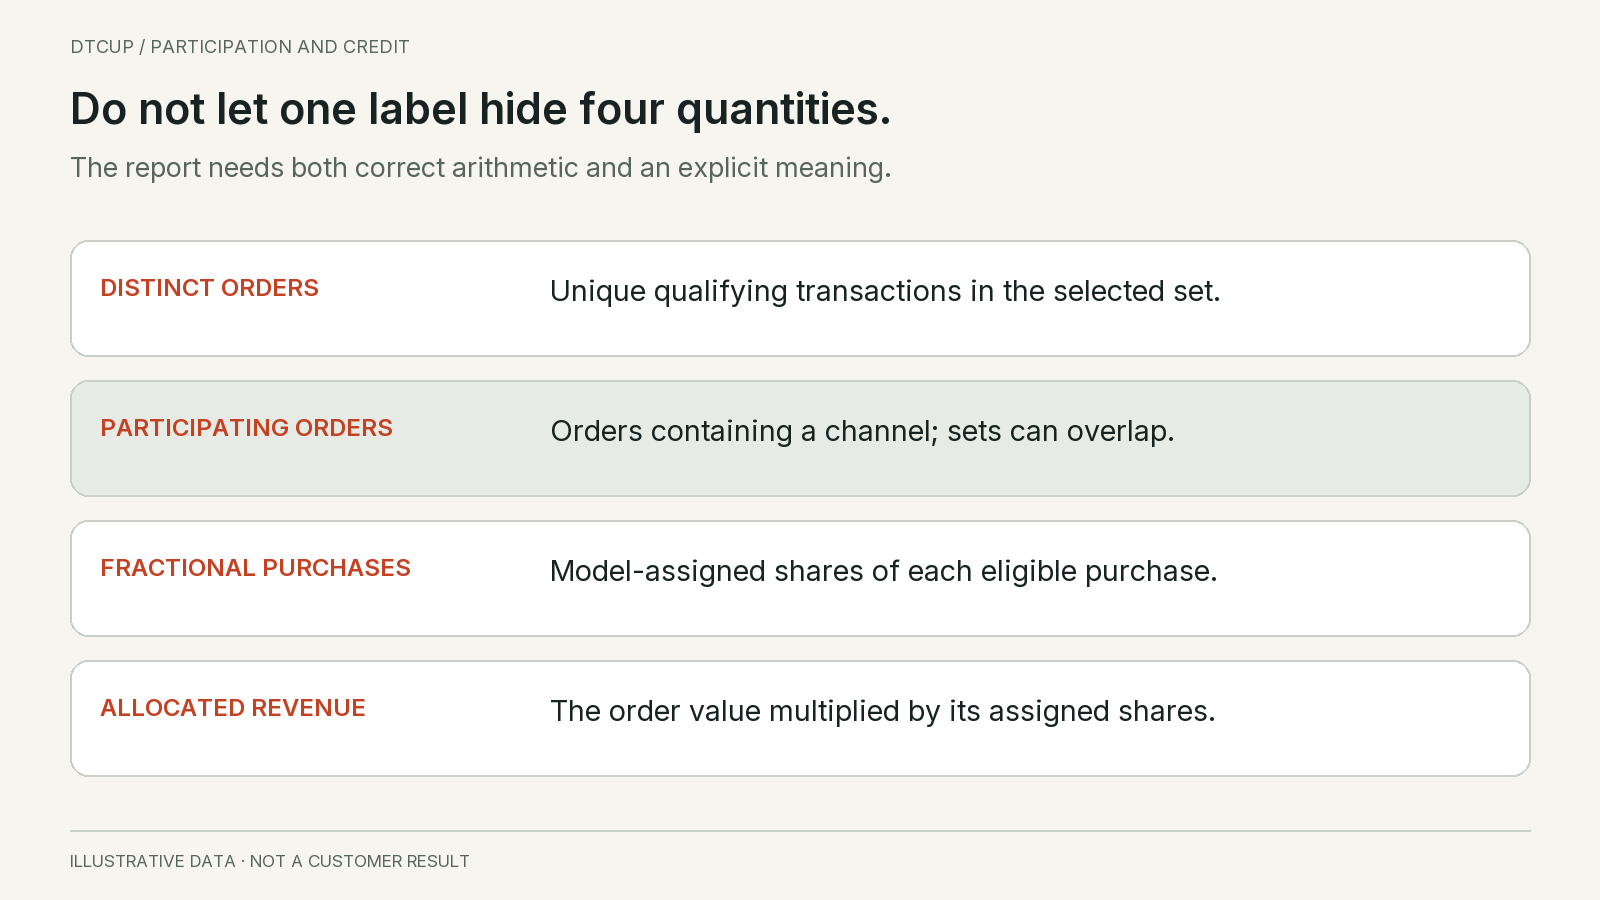
I would keep three quantities visible: distinct orders, participation and allocated credit. Each answers a legitimate question. The mistake is allowing a dashboard label such as conversions or revenue to hide which quantity is being shown. This guide uses a small fictional Meadow Works ledger to make the differences reproducible, then shows how to use them without inventing causal conclusions.
Name the quantity before reading the total
A distinct order count answers how many different qualifying transactions are present in the selected set. An order identifier should be scoped to the correct store or business source so unrelated transactions do not collide. Repeated tracking messages for the same order do not create additional purchases.
A participating-order count answers how many qualifying orders have at least one eligible interaction with a particular channel. The same order can belong to search and email. Within one channel, repeated eligible touches should not create additional distinct participating orders. Across channels, overlap is expected.
Fractional purchase credit answers how much of the selected orders a stated model assigns to each channel. If two channels split one order equally, each receives half a purchase of credit. That is an analytical share, not half a physical checkout, half a customer or a claim that the channel caused exactly half of the decision.
Allocated revenue applies those weights to each order’s defined revenue amount. If the eligible weights for an order sum to one, its allocated revenue sums back to that amount. Orders without an eligible observed path need an explicit unresolved treatment so they do not disappear from the business total.
Participation revenue is different again. It can show the full revenue of every order in which a channel participated. Several channels may each display the same order’s full amount. That can support an overlap analysis, but it is not a set of mutually exclusive shares of company sales.
Adobe’s attribution documentation explicitly distinguishes participation, which can total more than one hundred percent, from allocation models such as linear. The practical lesson extends beyond one product: read the metric definition before deciding whether its rows are supposed to add up.
Start with a small order ledger you can inspect
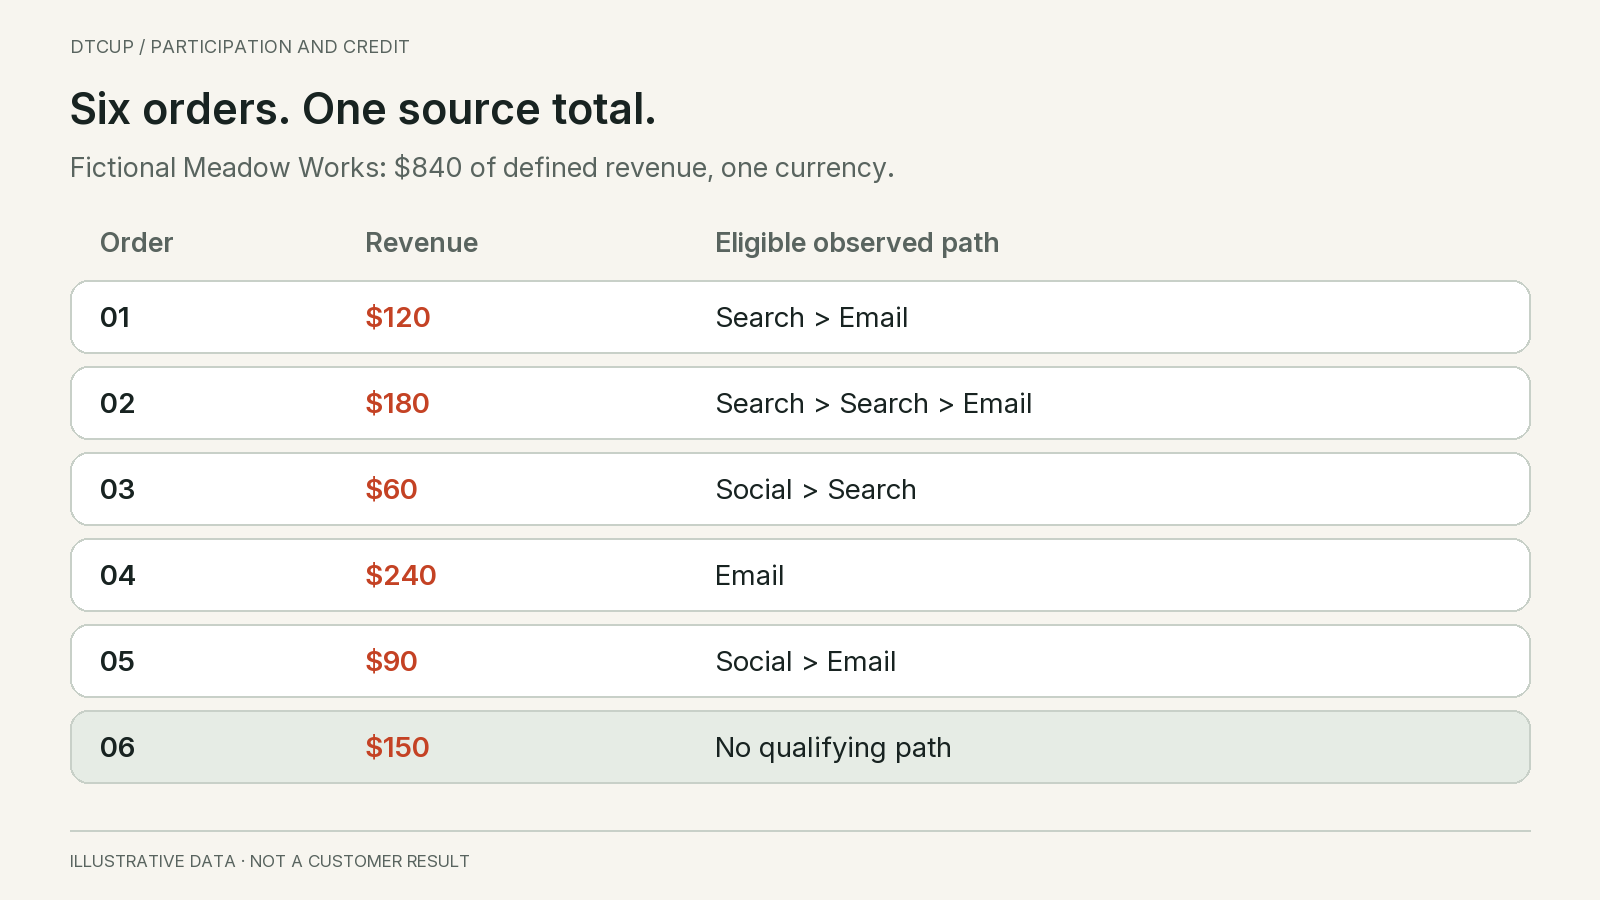
Meadow Works has six fictional orders in the chosen purchase period, with a total defined revenue amount of eight hundred forty dollars. For simplicity, the example uses one currency and a fixed already-reconciled revenue basis, with no later adjustments. The amounts are illustrative and are not real customer results.
Order One is worth one hundred twenty dollars and has a search touch followed by email. Order Two is worth one hundred eighty dollars and has search, another search touch and then email. Order Three is worth sixty dollars and has social followed by search.
Order Four is worth two hundred forty dollars and has email only. Order Five is worth ninety dollars and has social followed by email. Order Six is worth one hundred fifty dollars and has no qualifying observed path under the stated rules.
All listed touches are eligible and occur before their respective purchase within the same defined lookback rule. The second search touch for Order Two is a genuine separate eligible interaction, not a duplicated event. These assumptions matter because the example will compare equal-channel and equal-touch allocation.
The five orders with qualifying paths total six hundred ninety dollars. The remaining one hundred fifty dollars stays unresolved in the journey analysis. Missing a usable path does not mean the customer had no marketing exposure. It means this ledger cannot responsibly assign that order to a recorded channel.
Keep this source ledger available when reviewing the summary. A small set of known transactions is often more informative for diagnosing a report than a large chart. You can calculate the expected result by hand, identify exactly where a model differs and distinguish an intended rule from a data-processing defect.
Count participation without adding overlapping orders
Search participates in Orders One, Two and Three. Its distinct participating-order count is three, and the full revenue of those orders is three hundred sixty dollars. The two search touches on Order Two still contribute only one distinct order to that channel’s count.
Email participates in Orders One, Two, Four and Five. Its count is four and its participation revenue is six hundred thirty dollars. Social participates in Orders Three and Five, giving two orders and one hundred fifty dollars of participation revenue.
The channel counts add to nine, and the participation revenue adds to one thousand one hundred forty dollars. Those totals are not the number of orders or the store’s revenue. They reflect overlapping memberships in channel sets. The union of the three observed channel sets contains five orders worth six hundred ninety dollars.
Including the unresolved sixth order brings the distinct business total to six orders and eight hundred forty dollars. Do not add one hundred fifty to the overlapping participation revenue and call the resulting one thousand two hundred ninety dollars sales. That number has no valid interpretation as unique revenue.
Participation shares can use different denominators. Search appears in three of the six business orders, or fifty percent. It appears in three of the five orders with qualifying paths, or sixty percent. Both can be calculated, but the denominator must be stated. Changing it changes what the percentage describes.
Email, search and social participation percentages can legitimately sum above one hundred percent because the categories overlap. A pie chart is therefore a poor default display: its visual grammar suggests exclusive pieces of one whole. Use a table, an overlap view or clearly labeled bars instead.
A participation report becomes useful when it reveals combinations. Search and email overlap in Orders One and Two. Search and social overlap in Order Three. Email and social overlap in Order Five. These are observed associations in converting paths, not evidence that any particular combination caused more purchases.
Allocate credit by distinct channel when that is your chosen rule
Now apply an equal-channel rule. Each distinct eligible channel in an order receives the same share, regardless of how many eligible touches it recorded. This is a transparent modeling choice. It prevents repeated touches from increasing a channel’s total share merely through frequency, but it does not establish equal causal importance.
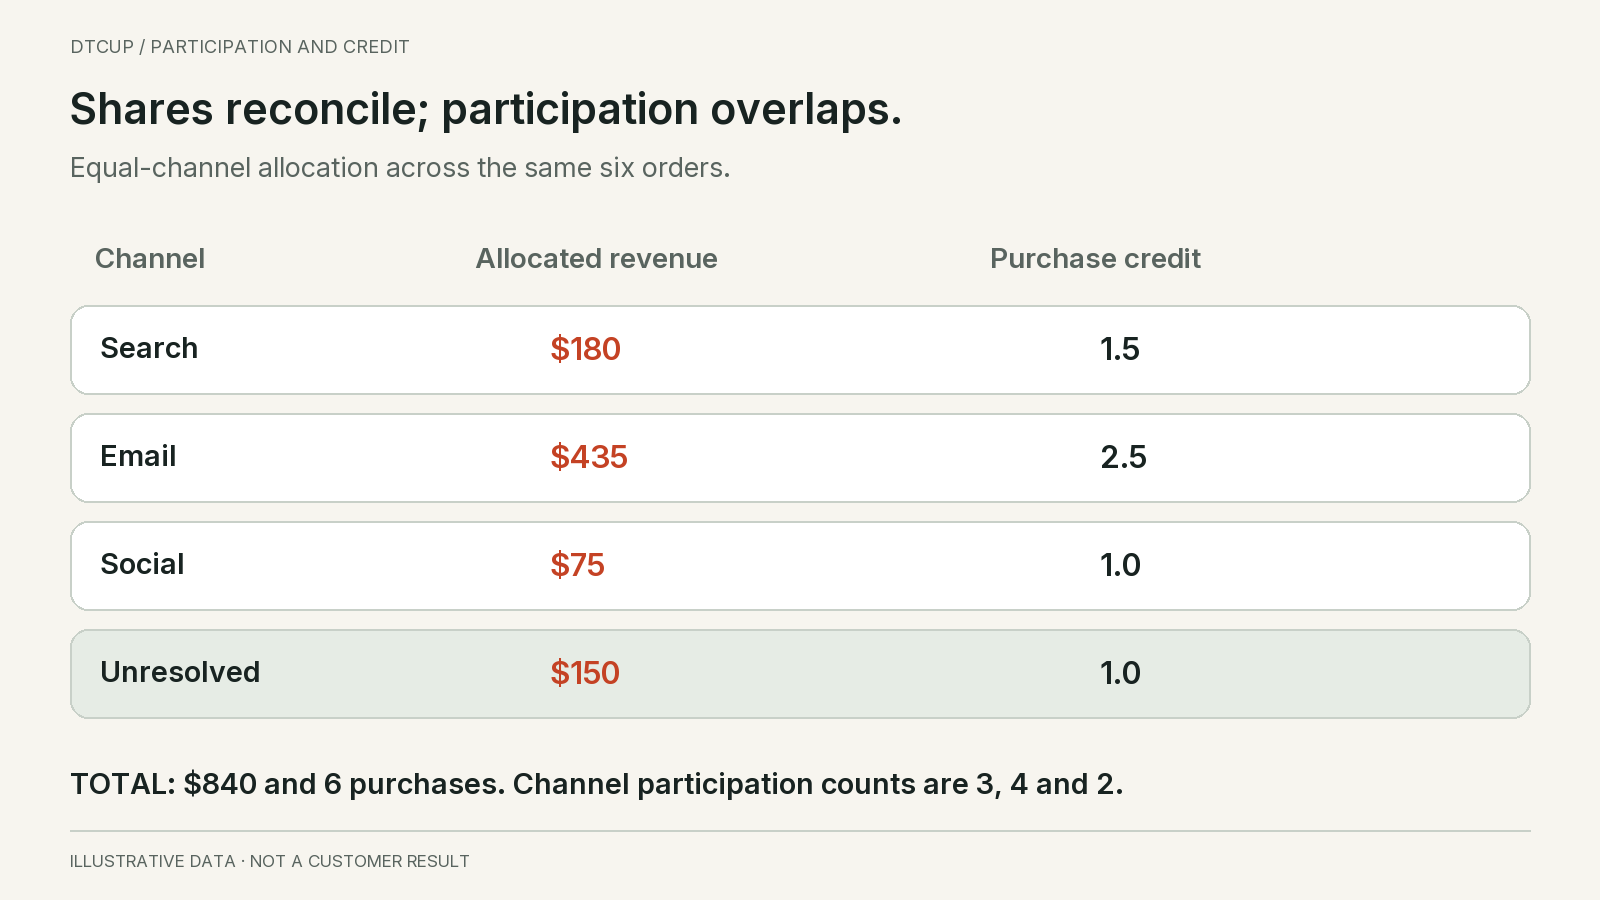
Order One splits its one hundred twenty dollars between search and email, giving sixty dollars and half a purchase of credit to each. Order Two also splits between those two distinct channels, giving ninety dollars and half a purchase to each, even though search appears twice.
Order Three gives thirty dollars and half a purchase to social and the same to search. Order Four gives its full two hundred forty dollars and one purchase to email. Order Five gives forty-five dollars and half a purchase each to social and email.
Across the five linked orders, search receives one hundred eighty dollars and one and a half purchases of credit. Email receives four hundred thirty-five dollars and two and a half purchases. Social receives seventy-five dollars and one purchase. Those revenue shares sum to six hundred ninety dollars and the purchase shares sum to five.
Retaining Order Six as one unresolved purchase worth one hundred fifty dollars brings the complete reconciliation back to six purchases and eight hundred forty dollars. This unresolved row is a reporting treatment for missing eligible evidence. It is not a marketing channel and should not be assigned a fabricated cost per click or campaign owner.
The channel-level distinct participating-order counts remain three, four and two. They do not become one and a half, two and a half and one. A useful interface can show both quantities with clear labels: how many orders contained the channel and how much purchase credit the model allocated to it.
Google Analytics’ attribution-path guidance explains why some model-based event metrics contain fractional credit. That does not mean all products use the same models or weighting rules. The calculations here are explicitly defined examples, not instructions to find a currently available linear-model selector in every analytics platform.
See how equal-touch weighting changes the answer
An equal-touch rule divides each order among its eligible interactions rather than its distinct channels. For every order except Order Two, the result in this small example stays the same because each participating channel appears once. Order Two exposes the difference.
Its one hundred eighty dollars is divided across three touches, giving sixty dollars to each touch. Search has two touches, so it receives one hundred twenty dollars and two thirds of a purchase. Email receives sixty dollars and one third of a purchase.
Compared with equal-channel allocation, thirty dollars moves from email to search on that order. Across the complete ledger, search now receives two hundred ten dollars, email four hundred five, social seventy-five and unresolved one hundred fifty. Total revenue remains eight hundred forty dollars. The business has not earned another dollar.
The fractional purchase totals also change. Search receives one and two thirds purchases, email two and one third, social one and unresolved one. Their sum remains six. Keep adequate internal precision and round only for presentation so tiny display differences do not become accounting-like discrepancies.
This comparison shows why tracking frequency matters. If one channel records every meaningful return visit while another records only an initial click, equal-touch allocation reflects that observation pattern as well as customer behavior. If duplicated events are mistakenly treated as additional touches, it can reward an instrumentation defect.
Do not solve that problem by deleting all repeated channel visits. Some are real and relevant to the analytical question. First deduplicate repeated reports of the same interaction. Then decide whether genuine repeated interactions should influence credit. Data cleaning and model selection are separate decisions.
The existing DTCUP attribution-model guide distinguishes Linear All, which allocates first by distinct channel, from Linear per touch. Use the documented implementation when reading DTCUP results. A model name without its actual weighting unit is insufficient for comparing tools.
Keep order-value denominators compatible
Average order value can become misleading when attributed revenue is divided by the wrong order count. In the equal-channel example, search has one hundred eighty dollars of allocated revenue, one and a half purchases of allocated credit and three distinct participating orders. These are all valid values, but they should not be mixed casually.
Dividing allocated revenue by fractional purchase credit gives one hundred twenty dollars for search. This is a model-weighted average under the specified calculation. Dividing the same one hundred eighty dollars by three participating orders gives sixty dollars of allocated revenue per participating order. That is another statistic, not the same average.
Email makes the difference clearer. Its allocated revenue of four hundred thirty-five dollars divided by two and a half fractional purchases gives one hundred seventy-four dollars. Its full participation revenue of six hundred thirty dollars divided by four participating orders gives one hundred fifty-seven dollars and fifty cents. These differ because the weighting of orders differs.
Neither number should be silently compared with a storewide average computed on another revenue basis. State whether the numerator is full order revenue, allocated revenue or another measure, and whether the denominator is distinct transactions or fractional credit. A familiar label does not make incompatible quantities comparable.
For a budget discussion, the weighted average may help describe the order mix associated with a model’s credit. It still does not reveal the value of the next acquired customer or the incremental return on more spend. Keep those causal and forward-looking questions separate from the arithmetic of an existing order cohort.
Prevent a data join from manufacturing revenue
An order table usually has one row per order, while a touch table has several rows per journey. Joining them can create several rows containing the same order amount. That is expected at the joined-row level, but summing the repeated amount without weights can inflate revenue.
Order Two illustrates the risk. Its one hundred eighty dollars appears beside three eligible touches after the join. A naive sum gives five hundred forty dollars. The order did not grow; the query repeated its value three times. The remedy is to define the output grain and allocation weights before aggregation.
Do not repair this with a distinct sum of revenue amounts. Two genuinely different orders can have the same value. If two separate customers each place a one hundred twenty-dollar order, summing distinct numeric amounts would count only one hundred twenty instead of two hundred forty. Deduplication must use the transaction identity, not the money value.
Use an order ledger as the authoritative total. Build eligible order-touch relationships separately, assign the model’s weights within each order, then aggregate weighted values. Keep a route for orders with no eligible relationship. At each stage, reconcile both unique order identifiers and money so a lost or multiplied transaction is visible.
Many-to-many joins can introduce a second multiplication. If each touch matches several campaign labels or each order matches several customer records, the number of rows can grow beyond the intended touch count. Test relationship cardinality and decide whether the category mapping is exclusive or intentionally overlapping.
A report can pass its grand-total check and still be wrong within channels. For example, a false identity link might move an order from unresolved to email while total revenue remains unchanged. Reconcile the totals, then inspect representative paths and matching evidence. The identity-stitching guide explains why preserving money does not prove the journey is correct.
Decide what a filter is supposed to do
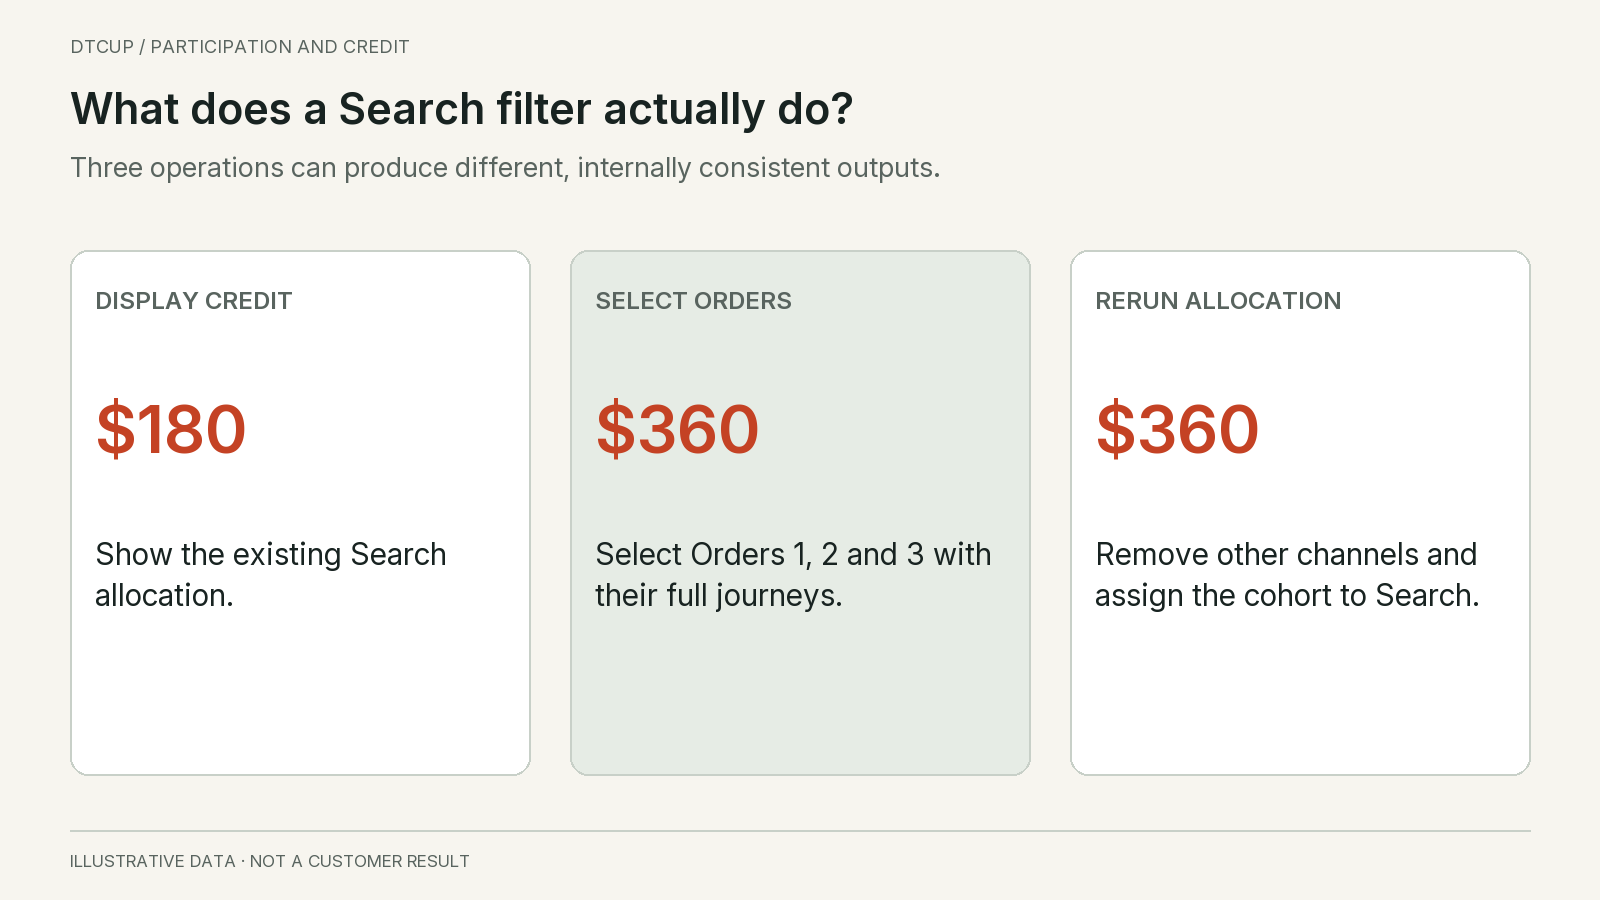
A channel filter can mean at least three different things. It might display only that channel’s existing allocated credit. It might select all orders where the channel participated and show their full journeys. Or it might remove other channels and rerun the allocation among the remaining touches. Those operations answer different questions.
In the equal-channel Meadow Works report, showing only the search row displays one hundred eighty dollars of allocated credit. Selecting orders in which search participated produces Orders One, Two and Three, worth three hundred sixty dollars in total. Reallocating those orders only to search would give search all three hundred sixty dollars.
The third result is not a more complete view of the first. It changes the model’s eligible set. If an interface silently renormalizes after filtering, a marketer can appear to improve a channel’s revenue by hiding competitors from the table. Make the behavior explicit before anyone uses the output for a decision.
For routine analysis, I prefer a stable allocation calculated on the agreed eligible path, followed by display filters that do not rewrite it. A separate order-cohort filter can help inspect the journeys involving a channel. If a paid-only model is desired, label it as a different model with its own eligibility and unresolved rules.
Exports should preserve this distinction. Include the purchase period, lookback rule, selected model, filter type, revenue basis and unresolved treatment. A screenshot with only a channel name and a revenue number is not enough for someone else to reproduce the conclusion.
Check totals after filtering according to the intended meaning. A displayed subset of allocated channels should not necessarily equal all store revenue. A selected order cohort should reconcile to its own distinct orders. A rerun model should reconcile under its new eligibility rules. There is no single total that validates every operation.
Understand how category granularity changes equal shares
Equal weighting depends on what counts as a distinct category. Search and social may be separate channels in one view and grouped into Paid in another. If the model allocates after grouping, it can produce a different result from allocating at the detailed channel level and then adding those results.
Consider a separate fictional one hundred twenty-dollar order with search, social and email. Equal allocation across the three channels gives forty dollars to each. If search and social are then displayed together as Paid, the Paid group shows eighty dollars and Email shows forty.
If the same path is grouped into Paid and Email before equal allocation, each group receives sixty dollars. Neither calculation changes the order value. The difference comes from choosing a different unit for equality. A report should not describe both as the same model without explaining that choice.
For stable comparisons, define the allocation grain and keep it fixed. Grouping existing results for presentation should sum the existing weights. If the business wants a new category-level allocation, treat that as an explicit analytical change and compare it separately.
Overlapping categories need another decision. A campaign might qualify as both Prospecting and Video under two different descriptive dimensions. Those labels can coexist, but summing their participation totals across dimensions would double-count activity. Use separate views or an explicitly defined exclusive mapping when additive totals are required.
Preserve mapping versions when categories change. Renaming a campaign or moving it to another group can alter a historical report without any change in customer behavior. State whether the report uses current classification or the classification recorded at the time. Both can be useful, but unexplained restatement undermines trust.
Build an overlap view that leads to a useful question
A small overlap table can show how often two channels appear in the same observed converting journey. In the Meadow Works ledger, search and email share two orders, search and social share one, and email and social share one. There are no three-channel paths in this particular six-order example.
The denominator changes the interpretation. Two shared search-email orders are two thirds of search’s three participating orders, but one half of email’s four. A symmetric count can therefore produce different directional percentages. Label whether the row or column channel supplies the denominator.
Do not add all pairwise overlaps to estimate a unique total in a larger dataset. An order involving three channels belongs to three pairs. Higher-order intersections require explicit set logic or a path-level grouping. For practical reporting, a table of mutually exclusive channel combinations can be easier to reconcile than a dense visual network.
Sequence adds another useful dimension. Search followed by email may raise a different operational question from email followed by search. Inspect representative paths and time gaps before proposing a coordinated campaign. The first recorded interaction may not be the first real exposure, so avoid turning observed order into a complete behavioral story.
Most importantly, these paths are selected because a purchase occurred. A high overlap among buyers does not show the conversion rate of that channel combination among everyone exposed to it. To estimate that relationship, you need an appropriate eligible population and still need to address selection and confounding. A converting-path report alone does not provide the denominator.
I would use the overlap view to form a bounded question: are customers returning through email after paid search, and is the follow-up message solving a real information gap? Then inspect content and service evidence, and use an appropriate experiment if the decision requires incremental impact. Avoid announcing that a common combination is the causal recipe for growth.
Keep coverage and attribution rules beside the result
The observed paths are only as complete as the permitted and available evidence. Consent choices, missing identifiers, incomplete history and unavailable provider data can all affect what appears. A channel with better observation may receive more visible participation without having a proportionately greater real influence.
Show the number and value of orders with qualifying paths, alongside unresolved orders. In the example, five of six orders are linked, but linked revenue is six hundred ninety of eight hundred forty dollars. Count coverage and revenue coverage need not be identical because order values differ.
Do not distribute unresolved revenue proportionally across observed channels merely to make every dollar look attributed. That would add an assumption, not recover a missing journey. If a separate modeled scenario is useful, label its assumptions and keep it distinct from the observed allocation. The coverage-ledger guide develops the diagnostic work behind that unresolved amount.
Keep the touch eligibility rule visible too. Clicks, sessions, partner claims and aggregate impressions are not interchangeable events. Do not infer that a specific buyer saw an advertisement from a channel-level impression total. A participation analysis should use the evidence it actually has, with the proper scope.
Changing the lookback window can change both participation and allocated shares. An older social touch may enter the eligible path, taking a share under equal-channel allocation. That is not new revenue; it is a different observation boundary. Compare windows on a consistent purchase cohort and preserve the original report settings.
Identity corrections can also restate prior paths. If an order was previously linked to the wrong account, repairing it may remove a channel’s participation. Keep the correction reason and affected reporting scope reviewable. Accuracy is more important than keeping every historical chart visually unchanged, but the change should be explainable.
Run reconciliation checks before sharing the report
Build a manual check with four small tables
You do not need a complex warehouse to verify a small example. Start with an order table containing the scoped order identifier, purchase date, revenue amount and currency. It should contain exactly one row for each qualifying order. Keep exclusions visible rather than deleting them without a reason.
The second table contains eligible touches: an interaction identifier, the associated order, channel, time and evidence type. Preserve the original event identity so a repeated delivery can be distinguished from a genuinely repeated visit. The relationship should say why the touch qualifies for this purchase under the selected window and matching rules.
The third table contains allocation rows. For equal-channel weighting, count distinct channels within each order and assign each a reciprocal share. If the display also needs touch-level detail, divide a channel’s share among its eligible touches without changing that channel total. For equal-touch weighting, assign the reciprocal of the eligible touch count directly to each touch.
The fourth table is a reconciliation sheet. It shows the source order count and money, the linked subset, the unresolved subset and the sum of allocated shares. A separate section lists distinct channel memberships and their union. Keep that section separate so someone cannot accidentally combine non-additive counts with allocated totals.
For Order Two, write the expected results before building formulas: two distinct channels, three genuine touches, one real order and one hundred eighty dollars. Equal-channel weights are one half each at channel level; equal-touch weights are one third each at touch level. This tiny fixture tests several important behaviors without requiring a production customer record.
When the manual result and the dashboard disagree, inspect the earliest point where their inputs differ. A missing touch, a category mapping or an excluded order can explain the result before the weighting calculation is reached. Avoid changing the formula merely to force agreement with a report whose scope has not been checked.
Do not average campaign ratios to create a channel result
Aggregation mistakes also occur after allocation is correct. Suppose a separate fictional search report gives Campaign A one hundred dollars of spend and three hundred dollars of allocated revenue. Campaign B spends nine hundred dollars and receives nine hundred dollars of allocated revenue. Their individual attributed ROAS values are three and one.
The simple average of those two ratios is two. The combined channel result is instead twelve hundred dollars of allocated revenue divided by one thousand dollars of spend, or one point two. The larger campaign contributes more spend, so an unweighted average gives the small campaign too much influence on the summary.
The same principle applies to cost per fractional purchase. Sum the compatible spend and fractional credit first, then calculate the ratio. Do not average campaign-level costs per purchase unless the weighting is explicitly chosen to reproduce the intended total. Show unavailable ratios when the denominator is zero rather than inventing a favorable value.
Keep spend scope compatible with the channel view. If a report includes only one website’s revenue but all account spend across several websites, the resulting ratio needs that limitation explained. If a paid-only allocation credits a different order set, it should not be compared silently with an all-channel model using another coverage boundary.
None of this arithmetic turns attributed ROAS into incremental return. The point is to make the descriptive calculation internally coherent before using it as one piece of evidence. A precise ratio with incompatible inputs is less useful than a clearly bounded estimate whose limits are visible.
Write a decision note that preserves what the report cannot prove
A useful note for Meadow Works would say that search appears in three of six orders, and two of those search orders also contain email. Under equal-channel allocation, search receives one hundred eighty dollars; under equal-touch allocation it receives two hundred ten. The thirty-dollar difference is driven entirely by a second recorded search interaction on Order Two.
That note explains the mechanism instead of merely announcing that search improved under another model. It also makes the next investigation concrete: verify that the repeated interaction is genuine and understand whether the question is about channel presence or interaction frequency. There is no reason to increase spend solely because a selector moved thirty dollars.
The note should also retain the unresolved order worth one hundred fifty dollars. If a later repair links that order to email, email’s report may improve without any new sales or campaign change. Compare the coverage revision separately from business performance so a tracking repair does not become a false success story.
For a real operating decision, add the relevant business evidence and a review point. A content change may be justified by recurring customer questions along the observed path. A budget change needs evidence about cost, contribution and likely incremental outcomes. Participation helps identify where to look; it does not settle every decision that follows.
Record the report settings with the note. If the team revisits the result next month, it should be able to reproduce the original interpretation or identify exactly which source, mapping, window or model changed. That is how an attribution report becomes a learning record rather than a competition to claim the same sale.
Define a rounding rule for small shares
Small datasets make display rounding especially visible. Three equal shares of a one hundred-dollar order cannot each be represented exactly to two decimal places. Keep precise weights internally and use a documented rounding approach for presentation or export. If cents must reconcile exactly, assign the residual by a stable stated rule rather than letting different screens choose different answers.
Purchase credit needs similar care. Three displayed shares of 0.33 sum to 0.99, although the underlying weights sum to one. That is a presentation issue, not a missing customer. Show enough precision or explain the rounding, and never convert each fractional share to a whole purchase before aggregation. Otherwise a single transaction can disappear or multiply depending on which rounding convention was used.
Verify the report in order
Keep reporting time consistent when checking repeated purchases. A returning customer can legitimately create two different orders, each with its own eligible pre-purchase path. Do not deduplicate those orders merely because the customer identifier is the same. Equally, do not let an interaction after the first purchase enter that earlier order’s path just because both orders belong to one account.
For example, a customer buys on Monday, clicks a new email on Wednesday and buys again on Friday. The Wednesday email can be considered for Friday’s purchase under the chosen rules, but it cannot explain Monday’s earlier purchase. Whether a Monday touch remains eligible for Friday depends on the documented window and journey policy. Write that rule explicitly and test it with fixed timestamps. This prevents a lifetime customer history from being treated as one undifferentiated bag of channels attached to every order. The customer-level total and order-level paths should remain connected without becoming the same unit of analysis.
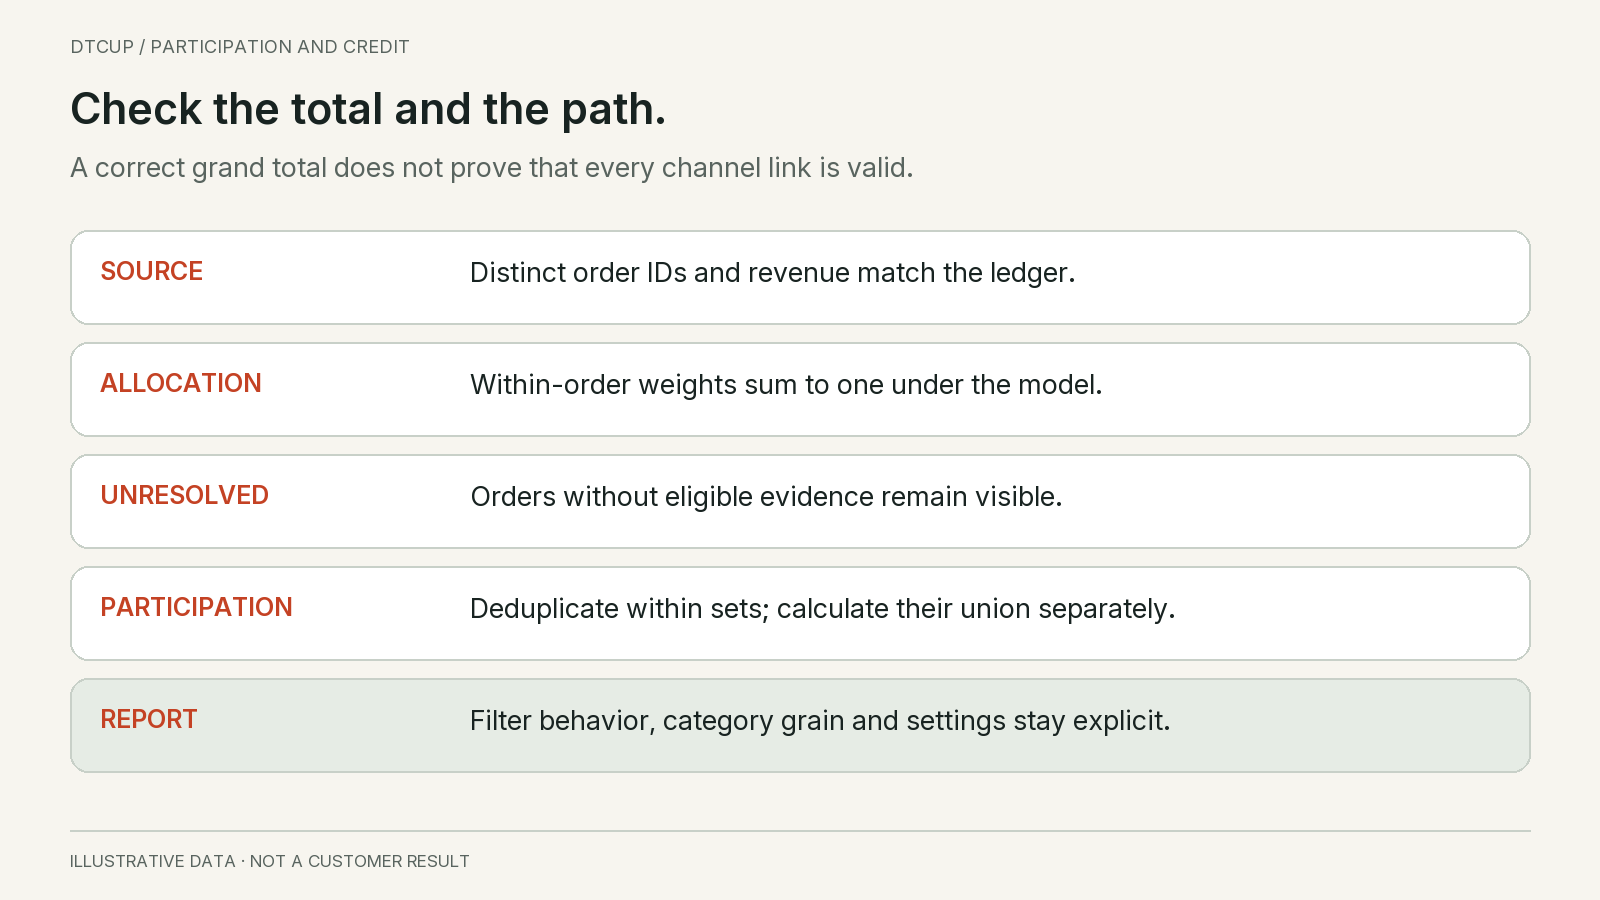
Begin with the authoritative order set. Confirm that the count of distinct qualifying orders and the sum of their defined revenue match the source. Then inspect duplicate event handling and order-touch relationship counts. A mismatch at this stage should be resolved before debating which allocation model is better.
For an additive allocation, check weights within each eligible order. They should sum to one under the stated model, with the unresolved treatment accounting for the remaining orders. Check that weighted purchase credit and weighted revenue reconcile across the full report. Keep a small numerical tolerance for implementation precision, not for unexplained business differences.
Test known edge cases: one channel, several channels, repeated genuine touches, duplicated event delivery, no eligible touch, equal timestamps, an out-of-window touch and a corrected order link. The expected result should be written before running the report, so the test does not merely bless whatever the system outputs.
For participation, test distinctness within each channel and calculate the union separately. Do not flag every above-one-hundred-percent total as an error. Instead, verify that the labels make non-additivity obvious and that the unique-order total is calculated from identifiers rather than by summing row counts.
Review the rendered dashboard and exported file together. A correct calculation can be undermined by a generic column heading, hidden denominator or export that drops model settings. The person making the decision should be able to tell whether a number is observed participation, allocated credit, full order money or unresolved evidence.
Questions about participation and fractional credit
Why do channel order counts exceed total orders?
If they are distinct participating-order counts, one order can appear in several channel rows. Calculate the union of order identifiers to recover the unique total. If the metric is supposed to be fractional allocated purchases, investigate the weighting or duplication because that measure should reconcile under its stated scope.
Is a fractional purchase a real order?
It is a share of analytical credit for a real qualifying order. The checkout remains a whole transaction. Keep fractional credit separate from distinct transactions and customers, and do not round each small share to a whole order before summing it.
Which linear rule is correct?
Equal-channel and equal-touch rules encode different assumptions. Choose based on the question and document the unit receiving equal weight. Compare their sensitivity on the same orders. Neither rule establishes causal impact, and a familiar model name does not guarantee identical implementation across products.
Can participation revenue determine the budget?
It can reveal common observed paths and help form hypotheses, but it overlaps across channels and does not measure incremental return. Use it with cost, contribution, coverage and suitable causal evidence. The channel decision framework explains how to match those different forms of evidence to the decision being made.
Sources
Still have a question?Ask the DTCUP Community ↗